What Does Android App Distribution Actually Cost on Google Play?
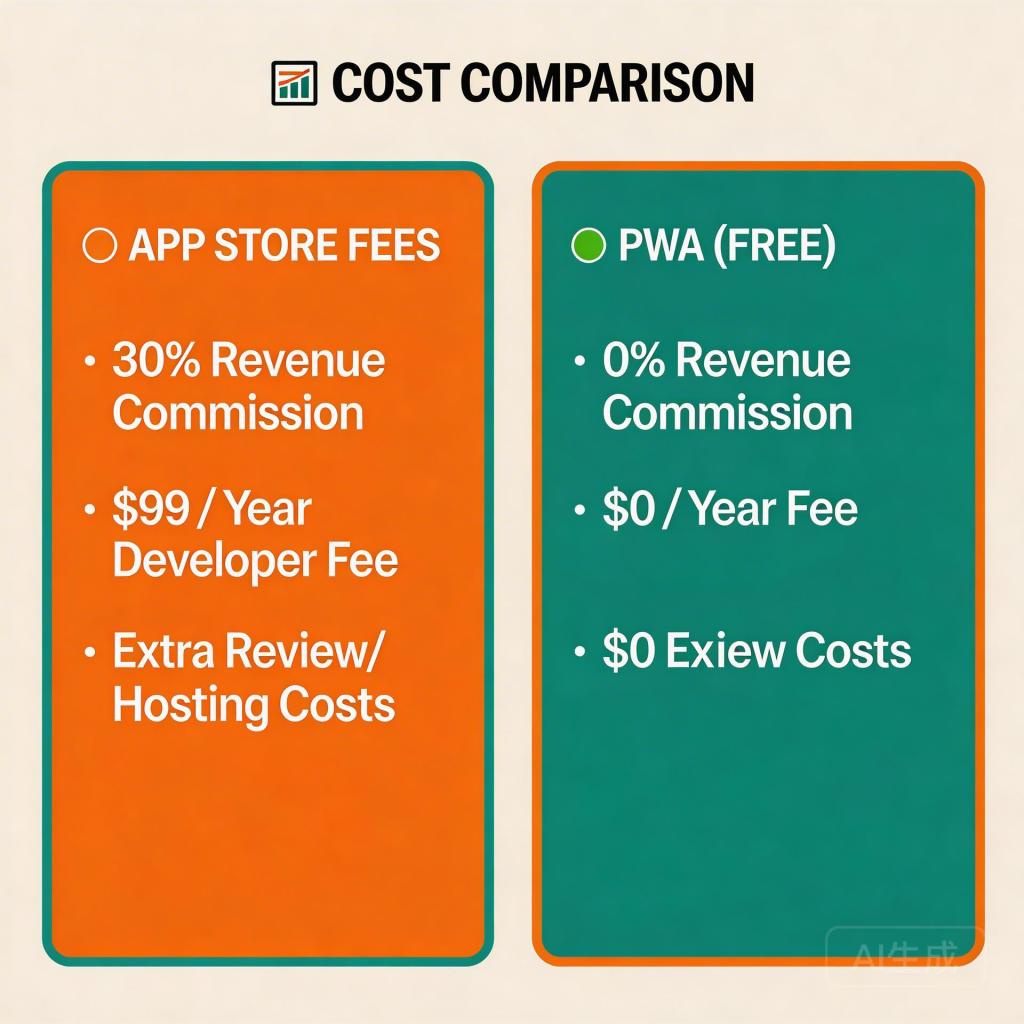
Google Play’s standard commission is 30% on all in-app purchases and subscriptions for apps earning over $1M annually — dropping to 15% on the first $1M (Google Play Help, 2023). For a mid-sized mobile game generating $3M/year in revenue, that’s $750,000 paid directly to Google — before a single line of your own operating costs.
→ Want to bypass Google Play entirely? See how ROiBest PWA works — no submission, no cut, 1.2x installs.
TL;DR: Google Play charges a 30% revenue cut on in-app purchases, while PWA distribution charges 0%. Beyond the fee difference, PWA installs convert at up to 1.2x the rate of native app downloads, and push notifications work even after the user uninstalls. For monetized Android apps, the cost gap is substantial — and measurable from day one.
The 30% Revenue Cut
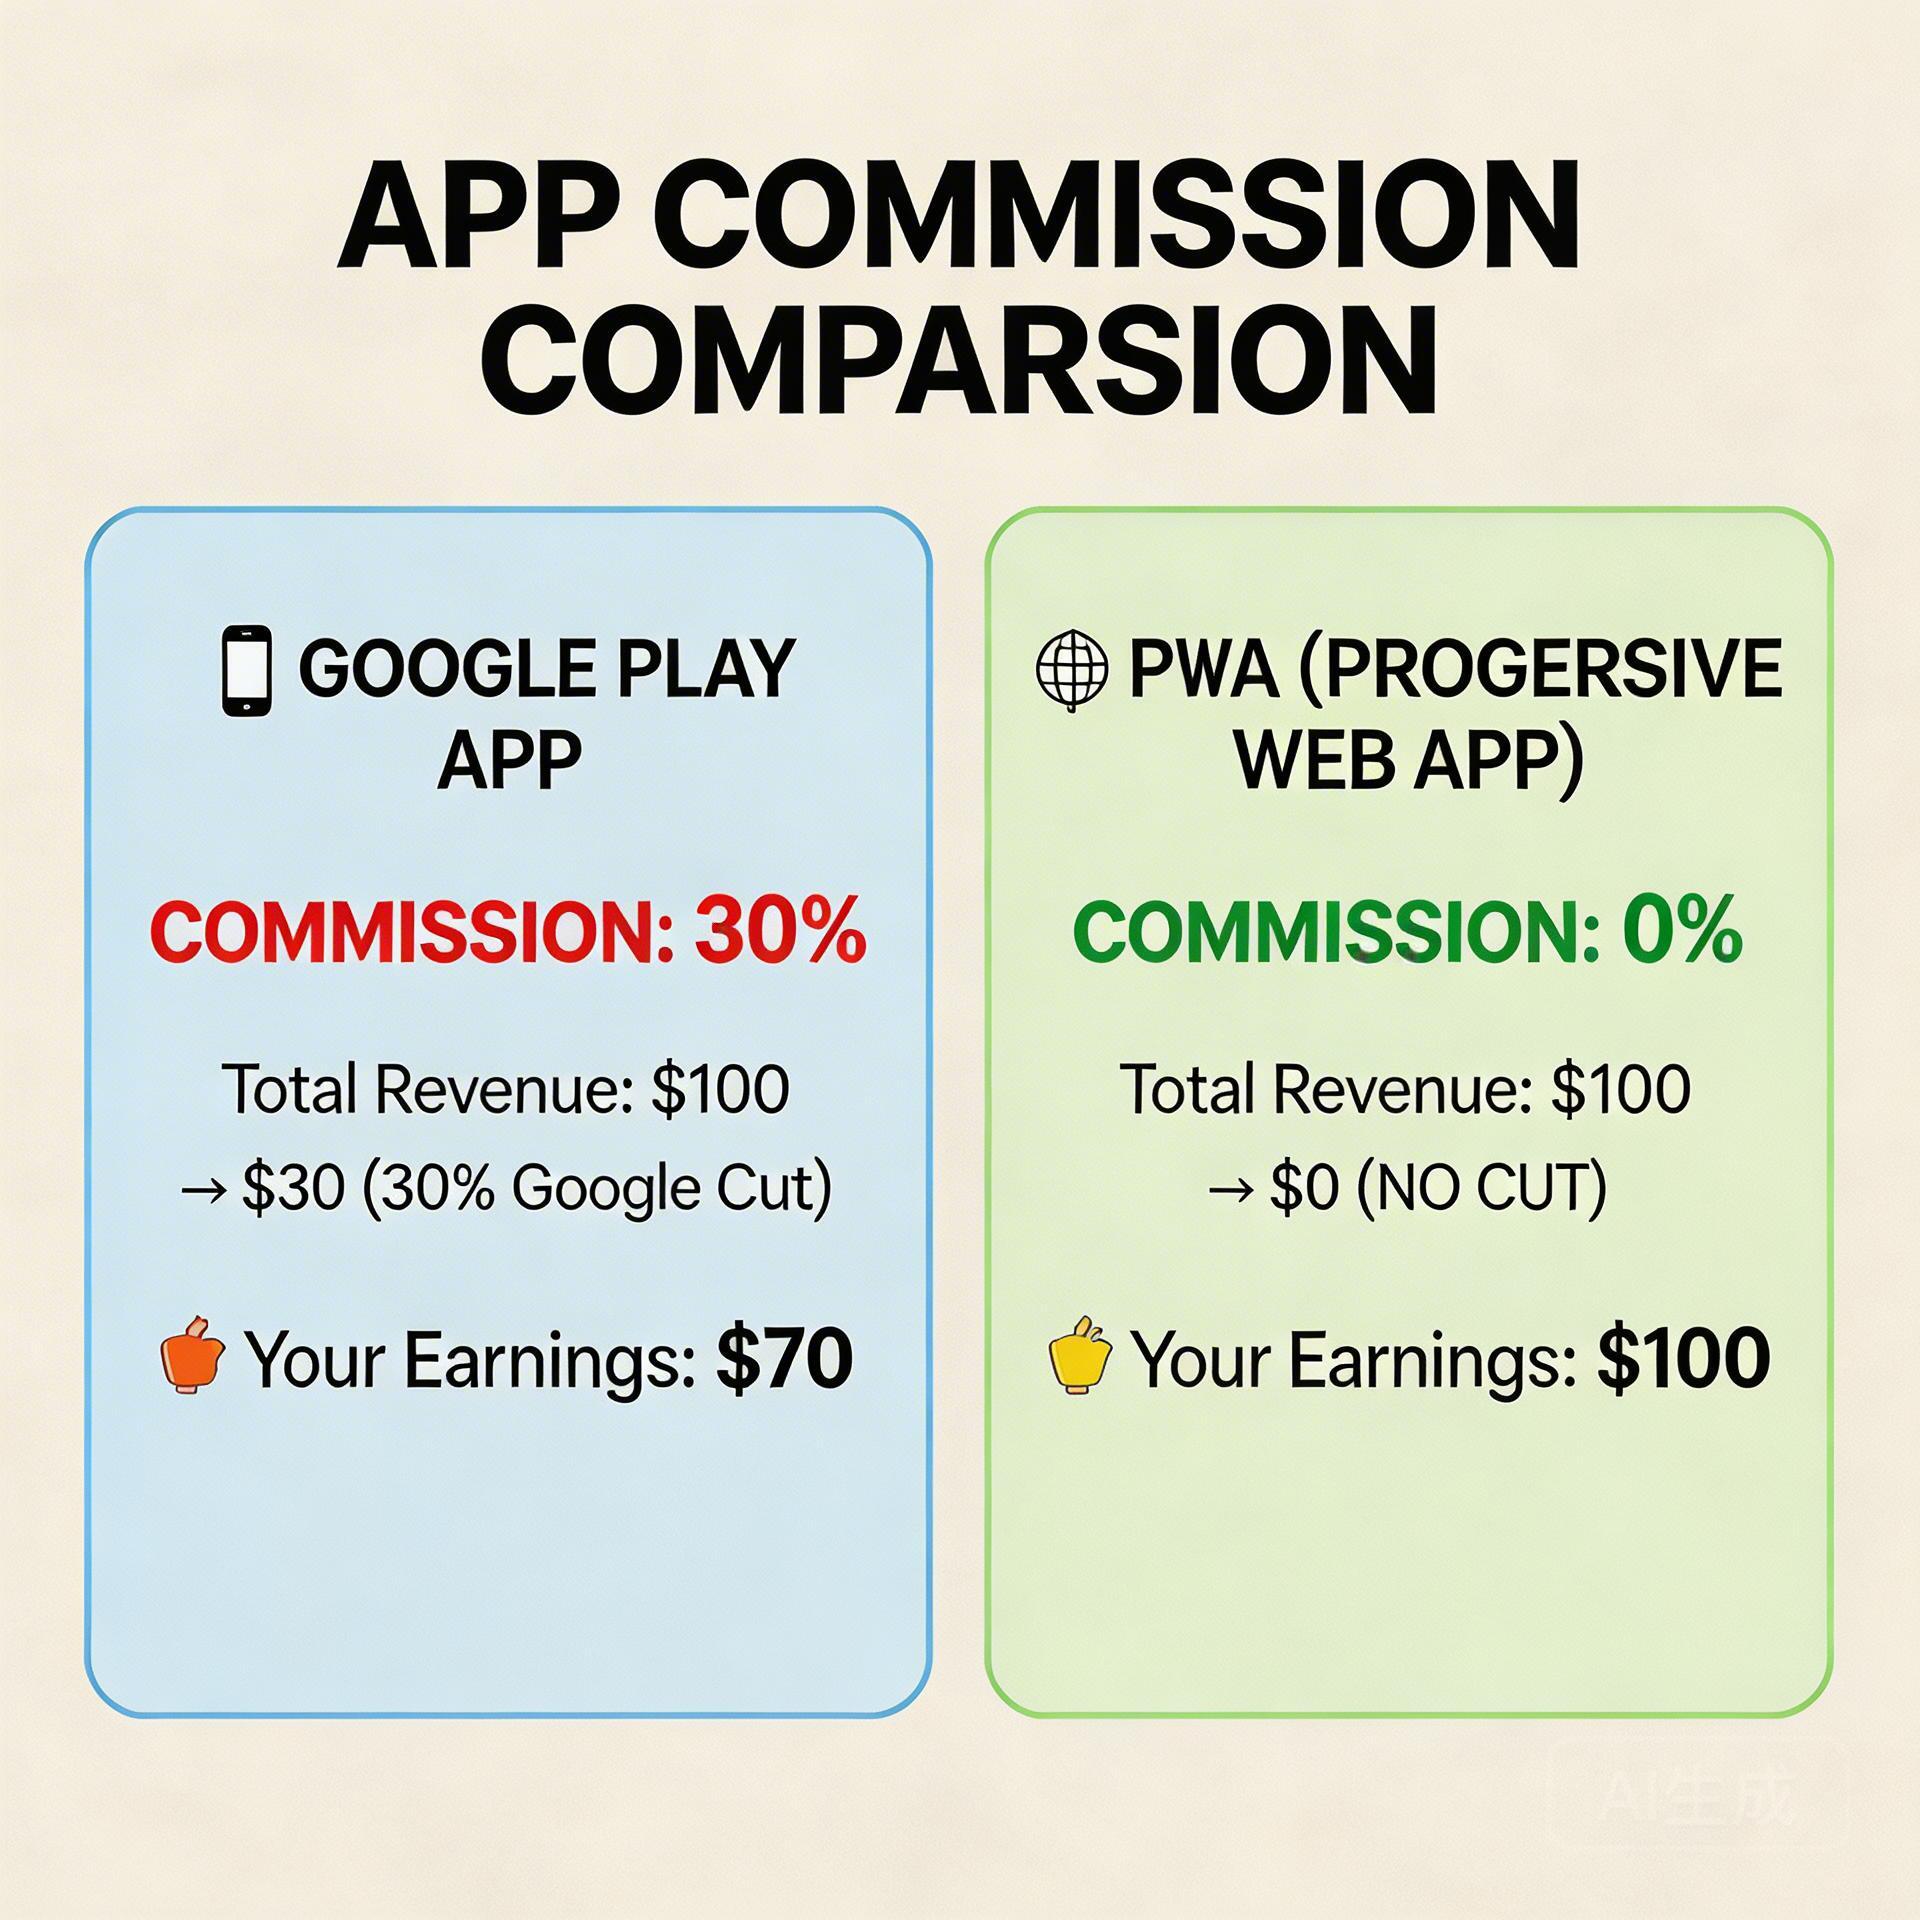
Google’s platform fee applies to all digital goods purchased inside the app. For the vast majority of monetized mobile apps — especially games — every dollar of in-app revenue loses 30 cents to the platform. On a $10 in-app purchase, you keep $7. Through PWA distribution, the same $10 purchase nets you $10 minus only your payment processor’s fee (typically 2-3%).
Submission, Review, and Rejection Costs
Google Play’s review process takes anywhere from a few hours to several weeks. Rejection rates for new apps have increased significantly as Google tightened policy enforcement in 2023-2024 (TechCrunch, 2023). Apps in sensitive categories (AI social, dating, gambling-adjacent games) face repeated review cycles, burning engineering time and marketing dollars tied to a launch that keeps slipping.
Post-Uninstall Revenue Loss
Once a user uninstalls a native app, you lose all contact. Industry data shows mobile app churn rates averaging 71% within 90 days of first install (Adjust Mobile Benchmarks, 2024). For Google Play apps, that churn is permanent.
How Does PWA Distribution Change the Cost Model?
PWA distribution eliminates the platform fee entirely — 0% cut on all in-app revenue. Users install the PWA directly from a web page to their Android home screen, with no app store intermediary. Teams using PWA distribution see up to 1.2x higher install conversion rates compared to native app store downloads (Google web.dev Case Studies, 2023).
Zero Platform Commission
For a team doing $5M in annual in-app revenue, moving to PWA distribution recaptures $1.5M in margin. That’s not a rounding error; it’s a business line decision.
For a complete breakdown of Google Play alternatives and how they rank by use case, see the Google Play Alternative: Android App Distribution Guide.
Faster Time-to-Market
PWA deployment has no submission queue, no review cycle, and no approval gate. Apps that launch during peak demand windows consistently outperform delayed launches by 2-4x in early install velocity (AppsFlyer, 2023).
PWA Install Conversion Rate Advantage
The user taps “Add to Home Screen” from a browser prompt, and the app is installed without leaving the page, without a separate download UI, and without waiting for a large binary. This frictionless flow produces measurably better conversion — up to 1.2x higher than equivalent native app campaigns.
What Happens to Push Notifications After Uninstall?
Native apps lose all push notification capability the moment a user uninstalls. PWA push notifications operate through the browser (Chrome on Android) — and they survive uninstall events. Re-engagement via post-uninstall push has shown 15-25% click-through rates in early mobile gaming tests, compared to 1-5% for re-targeting ads (OneSignal Push Benchmarks, 2024).
For teams trying to understand how post-uninstall push fits into a full retention strategy, the Android App Push Notifications After Uninstall: PWA Solution post covers the mechanics in detail.
Side-by-Side Cost Comparison: PWA vs Google Play
| Cost Dimension | Google Play | PWA Distribution |
|---|---|---|
| Platform commission | 30% of IAP revenue | 0% |
| Review delay (avg) | 3-14 days per submission | None — deploy same day |
| Rejection risk | Meaningful for AI, gaming, social | None |
| Install conversion rate | Baseline | Up to 1.2x baseline |
| Post-uninstall reach | Zero | Push notifications via Chrome |
| Distribution control | Google controls listing | Full control (your domain) |
Which App Types Benefit Most from PWA Distribution?
Mobile Games with In-App Purchases
Mobile gaming accounts for 43% of all app store consumer spend globally (data.ai, 2024). A game generating $5M in annual IAP revenue pays $1.5M/year to Google Play. Moving to PWA distribution recaptures that margin in full.
AI Social and Companion Apps
AI social, AI dating, and AI companion apps face disproportionate review scrutiny on Google Play. Policy updates in 2023-2024 significantly increased rejection rates for this category (TechCrunch, 2024). For these teams, PWA’s zero-rejection model isn’t a convenience — it’s an operational necessity.
FAQ: Android App Distribution Cost — PWA vs App Store
Does PWA work for all Android devices?
Chrome holds a 65% global mobile browser market share (StatCounter, 2024). For Android-first markets, PWA coverage is effectively universal.
Can users tell the difference between a PWA and a native app?
After installation, a PWA sits on the home screen with a custom icon, launches in full-screen mode, and behaves like a native app. User studies find that fewer than 20% of PWA users identify the app as “not native” when installed (Google web.dev Case Studies, 2023).
Is the 30% Google Play cut avoidable in any other way?
Google reduced its standard cut to 15% for the first $1M in annual earnings in 2021 (Android Developers Blog, 2021). But alternative billing adoption has been slow and Google still charges a service fee. PWA remains the only distribution path that fully eliminates the platform commission.
Conclusion: The Real Cost of Staying on Google Play
The android app distribution cost comparison between PWA and app store comes down to one question: how much of your own revenue do you want to keep? Google Play comes with a 30% tax on everything you earn inside it, a review process you don’t control, and a permanent hard stop on every user who uninstalls.
PWA distribution removes all three constraints. Zero commission. Zero review delay. A push channel that survives uninstall. The install conversion data — up to 1.2x over native — means you’re not sacrificing reach to get those economics.
Skip the app store. Go live instantly, keep 100% of your revenue.
ROiBest helps Android app teams launch PWAs — no review process, no 30% Google Play cut, and push notifications that work even after uninstall. Teams see up to 1.2x higher install conversion rates vs native app downloads.

留下评论