Your PWA is live and running Google Ads traffic. But the install rate is stuck at 6–8%, while industry benchmarks for optimized PWA landing pages sit at 20–28%. That gap — 15+ percentage points — isn’t a traffic quality problem. It’s an install funnel problem, and it’s entirely fixable.
This guide covers the specific elements of PWA landing page design that drive install conversion rates for overseas app teams in 2026: what to test, what to fix, and what benchmarks to use to measure progress.
→ Want to bypass Google Play entirely? See how ROiBest PWA works — no submission, no cut, 1.2x installs.
What “Install Conversion Rate” Actually Measures
Before optimizing, define exactly what you’re measuring. PWA install conversion rate is the percentage of landing page visitors who complete the “Add to Home Screen” action — accepting the browser’s install prompt and adding the PWA icon to their home screen.
This is different from:
- Click-through rate (ad click to landing page visit)
- Registration rate (landing page visit to account creation)
- First session engagement rate (install to first meaningful action)
Install conversion rate is your landing page’s core job. Everything else — re-engagement, LTV, ROAS — depends on getting this number right first. For most overseas app teams, this is where the most money is being left on the table.
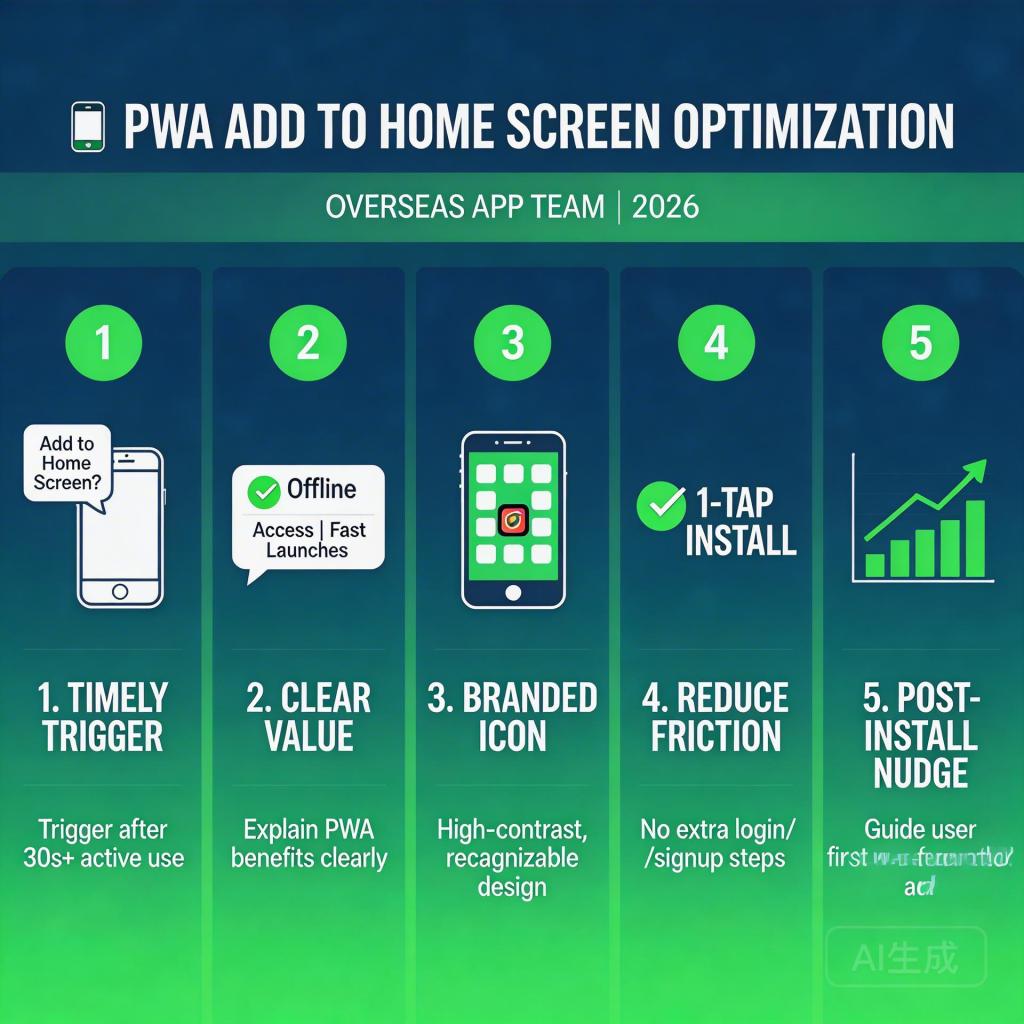
The Five Elements That Drive PWA Install Rates
1. Page Load Speed
No other factor has a more direct, measurable impact on PWA install rates than page load speed. Data consistently shows:
- Pages loading in under 2 seconds: average PWA install rate 18–26%
- Pages loading in 3–4 seconds: average install rate 10–14%
- Pages loading in over 5 seconds: average install rate below 7%
For overseas app teams targeting emerging markets (Southeast Asia, South Asia, Latin America), network conditions are often slower than Tier 1. Landing pages that perform fine on a US LTE connection may be unusably slow on a 3G connection in Indonesia or Brazil. Test your page under throttled network conditions before any paid campaign.
Optimization steps:
- Compress all images to WebP format (80–90% size reduction over JPEG with equivalent quality)
- Defer non-critical JavaScript (analytics scripts, chat widgets) until after first paint
- Use a CDN with edge nodes in your target geo — not just a US or EU origin server
- Set a PageSpeed Insights target of 80+ on mobile before running paid traffic
2. Above-the-Fold Clarity
Users decide within 5 seconds whether to stay or leave. Your landing page’s first screen must answer three questions without scrolling:
- What is this? — App name and category in plain language
- What’s in it for me? — Primary benefit, specific and concrete (not “best gaming experience”)
- How do I get it? — Visible install CTA, not buried below the fold
Common mistake for overseas app teams: leading with the product logo and tagline before establishing the core value proposition for the local audience. A gaming app named in English that leads with brand identity will consistently underperform a page that leads with “Play [GameType] games — free, no download, start in 10 seconds.”
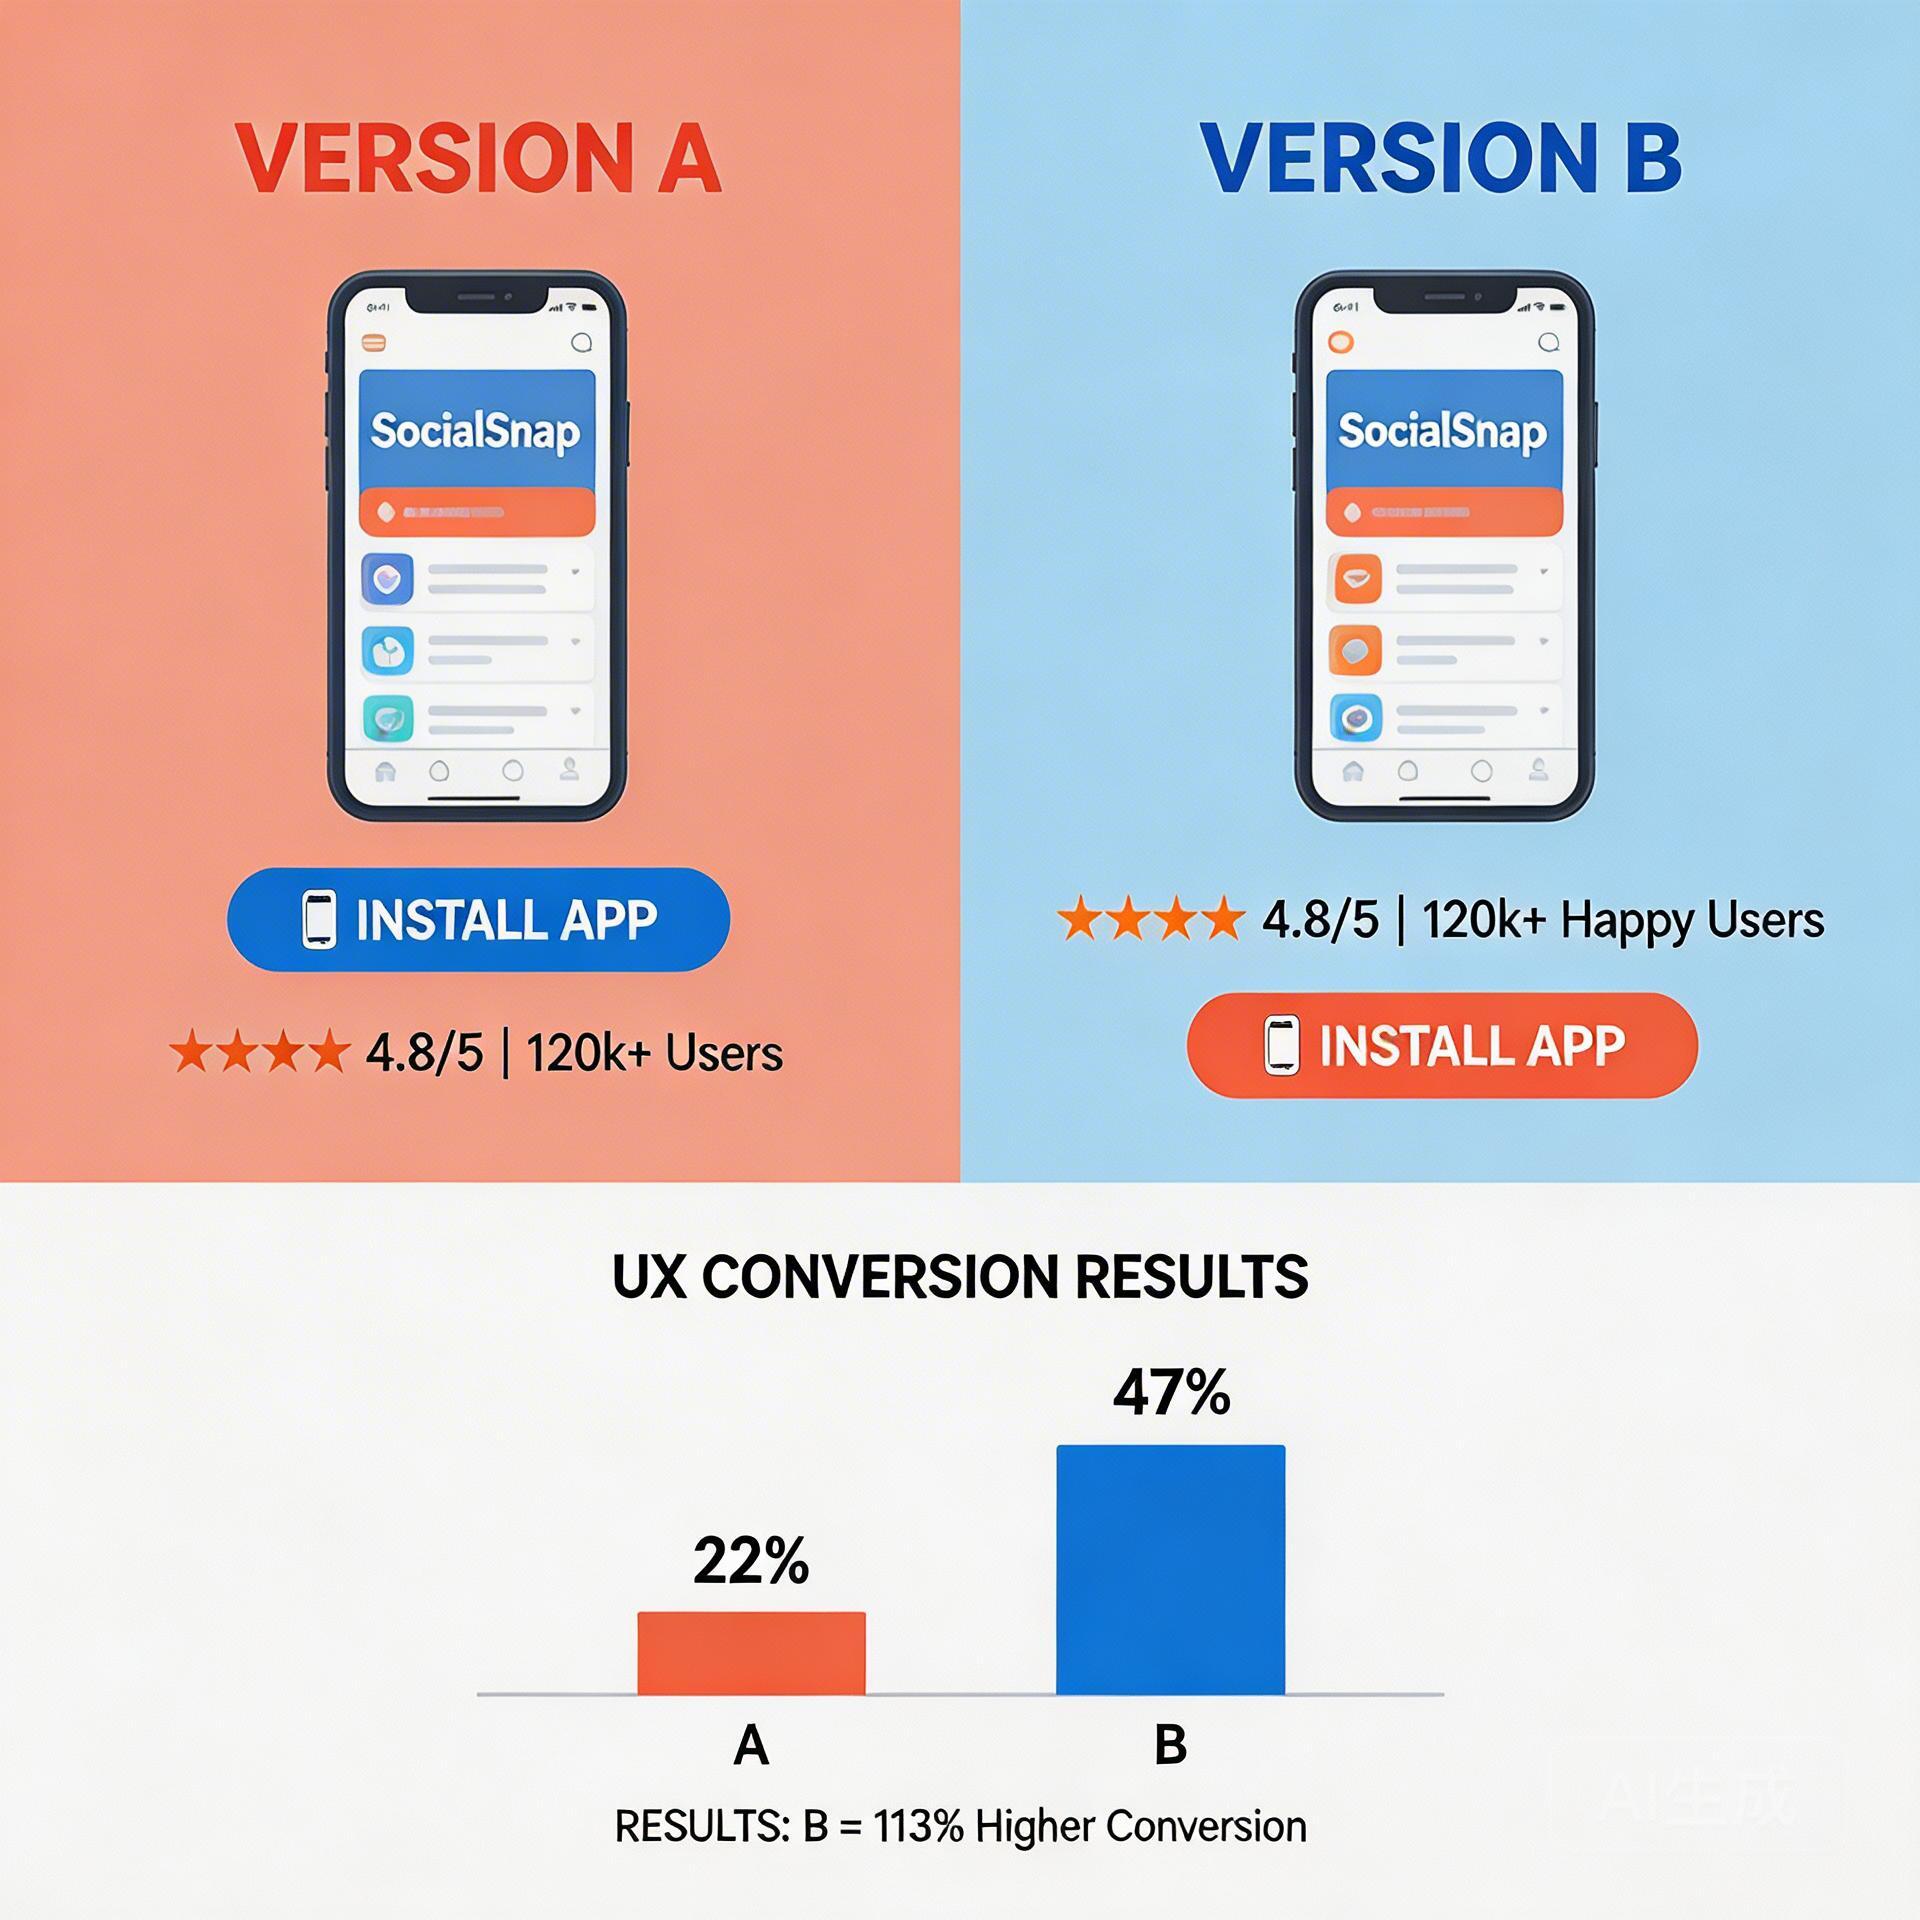
3. Social Proof Placement
Install count, rating, and testimonial placement has a large and measurable effect on conversion. The rule: social proof must appear before the install prompt, not after.
Placement that works: install count and star rating directly adjacent to the install CTA button — on the same visual unit, not separate sections. Users who see “2M+ installs ★★★★★” next to “Add to Phone” are 35–45% more likely to click through than users who see the CTA alone.
For overseas app teams without established brand recognition, this is especially critical. When users don’t recognize the brand, they rely on social signals to assess legitimacy. A visible install count functions as implicit endorsement from the crowd.
4. Install Prompt Trigger Timing
The browser’s native install prompt is not a substitute for your landing page CTA — it’s the final step in a deliberate sequence. Triggering it immediately on page load is one of the most common conversion-killing mistakes.
Optimized trigger sequence:
- User lands → page loads → no prompt
- User scrolls to 50–60% of page or spends 25–30 seconds on page → soft CTA appears: “Add [App] to your phone” with a simple icon button
- User taps soft CTA → browser’s native install prompt fires
This sequence consistently produces 3–5x higher install rates than immediate prompt in controlled tests. The reason: users who reach the soft CTA are pre-qualified — they’ve read enough to decide. Native prompt rejection rates from cold visitors run 60–75%; rejection rates from users who have clicked a soft CTA first run 15–25%.
5. Mobile-First Layout and Interaction Design
PWA installs happen on mobile. If your landing page was designed on desktop and adapted for mobile, it will underperform a mobile-first design. Key mobile considerations:
- Touch target size: Install CTA button should be at least 48x48px — anything smaller creates tap errors and frustration
- Font size: Body text minimum 16px on mobile; sub-16px triggers default browser zoom and layout breaks
- Horizontal scrolling: Zero tolerance — any element that causes horizontal scroll will break the install prompt trigger
- One CTA per screen: Don’t compete with “Learn More,” “Watch Video,” and “Install” on the same screen. Mobile users don’t evaluate multiple options — they follow the single most prominent action.
For a broader look at PWA distribution options versus Google Play alternatives, see our guide on Google Play alternative for Android app distribution in 2026.
A/B Testing Priorities for PWA Landing Pages
With limited testing bandwidth, prioritize in this order:
- Headline test: Value-led vs. brand-led vs. social-proof-led. Highest variance element. Run for 500+ visitors per variant before calling.
- Social proof position: Above install prompt vs. below. Smaller variance but fast to test.
- Install prompt trigger timing: 30 seconds vs. 60 seconds vs. 60% scroll. Requires engineering support but high impact.
- CTA button copy: “Add to Phone” vs. “Install Free” vs. “Play Now.” Lower variance than headline; test last.
Don’t run more than one test at a time on a low-traffic landing page. Results will be uninterpretable. For teams with under 1,000 daily visitors, run tests for at least 2 weeks to get statistically meaningful results.
To see how PWA distribution compares to other alternatives for overseas app teams, read our full guide on AI app launch without review: why PWA wins in 2026.
For the complete distribution landscape, including all Google Play alternative options, see our Google Play alternative for Android app distribution guide.
Measuring Progress: PWA Install Rate Benchmarks
| Traffic Source | Baseline | Optimized | Best-in-class |
|---|---|---|---|
| Google Ads (PMAX) | 8–12% | 18–24% | 28–35% |
| Meta Ads | 6–10% | 15–20% | 25–30% |
| Organic / SEO | 12–18% | 22–30% | 35–45% |
| Referral / Social | 15–22% | 25–35% | 40–50% |
If you’re below the baseline for your traffic source, start with page speed and above-fold clarity. If you’re in the baseline-to-optimized range, focus on social proof placement and prompt timing. If you’re already optimized, CTA copy and mobile interaction refinements are your marginal gains.
Action Checklist: PWA Landing Page Conversion Rate 2026
- ☐ PageSpeed Insights mobile score: 80+ before paid campaigns
- ☐ Test under throttled 3G if targeting emerging markets
- ☐ Above-fold answers: What? What’s in it for me? How to get it?
- ☐ Install count / rating adjacent to (not below) the CTA button
- ☐ 3-stage prompt trigger: scroll 50-60% or 25-30 seconds → soft CTA → native prompt
- ☐ CTA button: minimum 48x48px touch target
- ☐ No horizontal scrolling on any mobile viewport
- ☐ Single primary CTA per screen on mobile
- ☐ A/B test headline first, then social proof position, then trigger timing
- ☐ Track install rate by traffic source; compare to benchmarks above
Skip the app store. Go live instantly, keep 100% of your revenue.
ROiBest helps Android app teams launch PWAs — no review process, no 30% Google Play cut, and push notifications that work even after uninstall. Teams see up to 1.2x higher install conversion rates vs native app downloads.

留下评论