If you run paid acquisition for an Android app targeting European markets, your cost structure just got more expensive — again. Meta began rolling out digital services tax (DST) surcharges across multiple countries in early 2026, quietly adding 2–5% on top of ad spend in France, Spain, Italy, Austria, and several other markets. For teams already squeezed by rising CPMs and tightening ROAS targets, this is a compounding problem.
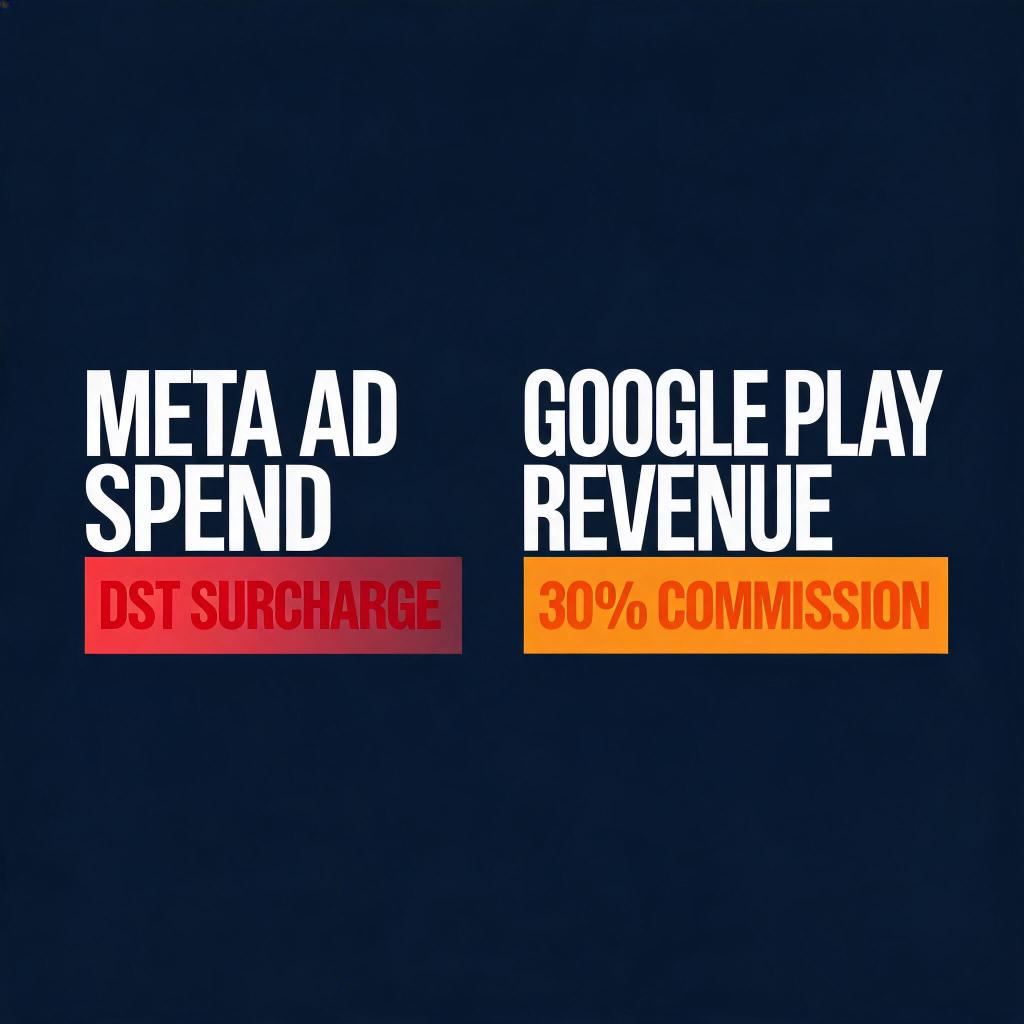
But here’s what most app operators are missing: the Meta surcharge is only half the story. When you combine a DST-inflated acquisition cost with Google Play’s standard 30% revenue commission, the actual cost of acquiring and monetizing a user in Europe has reached a level that fundamentally changes the unit economics of app distribution. For some verticals — gaming, subscription apps, fintech utilities — it no longer makes financial sense to pay both fees simultaneously.
This article walks through the real numbers, and explains why a growing number of overseas app teams are shifting to PWA distribution as a direct response — not as a technical experiment, but as a business decision driven by cost math.
→ Want to bypass Google Play entirely? See how ROiBest PWA works — no submission, no cut, 1.2x installs.
The Problem: Meta DST Surcharges Are Raising Ad Costs Across Europe
Digital services taxes are not new — France pioneered them in 2019, and the UK followed in 2020. What’s new in 2026 is the breadth of Meta’s surcharge rollout and the fact that it now covers a critical mass of European markets simultaneously. Meta’s official policy passes the DST cost directly to advertisers in each affected country, applied as a line-item percentage on top of your standard ad billing.
Here’s a quick overview of the confirmed surcharge rates in effect for 2026:
- France: 5% DST surcharge
- United Kingdom: 5% DST surcharge
- Spain: 3% DST surcharge
- Italy: 3% DST surcharge
- Austria: 5% DST surcharge
- Turkey: 5% DST surcharge
- India: 2% equalization levy surcharge
If your monthly Meta budget is $50,000 and 60% of it targets France, UK, and Austria — three 5% markets — your effective ad spend increase is around $1,500 per month, or $18,000 annually. That’s not catastrophic on its own. But it arrives on top of a cost structure that’s already under pressure.
Consider what a typical user acquisition funnel looks like for an app with European exposure:
- You pay Meta to acquire the user (now 3–5% more expensive in many key markets)
- The user lands on a Google Play store page, where friction reduces conversion
- The user installs and makes a purchase inside the app
- Google takes 15–30% of that in-app purchase revenue
Two separate platforms. Two sets of fees. Both trending upward. And neither gives your team any flexibility over pricing, terms, or user relationships.
For app teams running cross-border operations, the combined effect is a meaningful margin compression. The Meta DST surcharge is the trigger, but the underlying structural problem is dependence on a two-platform distribution stack where you have no leverage.
PWA Distribution: How It Solves the Cost Problem
A Progressive Web App (PWA) distributed directly to users eliminates the Google Play layer entirely. There’s no store submission, no app review, no revenue commission. When a user installs your PWA and makes a purchase through it, you keep 100% of that revenue — or more accurately, you pay only your chosen payment processor’s rate, typically 1–3%.
This is not a niche workaround. It’s a legitimate distribution channel that several hundred million Android users already interact with daily — through apps they’ve added directly to their home screen from a browser. The key shift is in how you think about distribution: instead of submitting to a gatekeeper, you own the entire install-to-purchase journey.
From a business operations standpoint, the practical advantages compound quickly:
No Revenue Commission
Google Play’s standard 30% commission (15% for the first $1M under Play’s small developer program) is the single largest hidden cost in mobile app distribution. On a subscription app generating $100,000/month in European revenue, that’s $30,000 going to Google — every month. PWA distribution routes that revenue directly to you. For apps with in-app purchases or subscriptions, this is typically the most impactful cost change in the entire P&L.
No Store Review Risk
App store rejections and arbitrary policy enforcements are a real operational risk for many categories — especially fintech, gambling-adjacent content, and lifestyle apps. A Google Play rejection doesn’t just delay your launch; it can derail an entire campaign. PWA distribution is not subject to Play Store policy review. You launch when you’re ready, update whenever needed, and don’t risk a takedown.
Push Notifications After Uninstall
This is one of the most underappreciated capabilities of modern PWA deployment. Properly configured PWAs can continue delivering web push notifications to users even after the app icon has been removed from their home screen. For retention-focused teams, this extends the re-engagement window significantly beyond what native apps allow.
Faster Campaign Iteration
When you’re running paid acquisition and you want to update an onboarding flow, change a pricing page, or test a new CTA — with a Google Play app, that’s a submission cycle. With a PWA, that’s a content update. The operational agility difference matters especially when you’re responding to cost changes like the Meta DST surcharge and need to optimize landing pages quickly.
For teams managing cross-border acquisition across Europe, the combination of eliminating the Play Store commission and gaining operational agility directly addresses the margin pressure introduced by Meta’s DST surcharges. It’s a structural fix, not a patch. You can read a full breakdown of channel options in this Google Play alternative distribution guide.
Real Data Comparison: Install Rates, Revenue Retention, and Cost Savings
Business decisions require numbers. Here’s what teams that have shifted to PWA distribution are reporting, along with benchmark comparisons from industry data:
Install Conversion Rates
One of the most consistent findings across PWA deployment case studies is that the install conversion rate from paid traffic is higher than equivalent Google Play Store traffic — typically 1.2x. The mechanics are straightforward: a PWA install from a landing page requires fewer steps than a Play Store redirect. Users don’t need to navigate a store page, scroll through reviews, or grant permissions before seeing value. The install friction is lower, and that directly improves conversion from paid traffic.
For a campaign running at $0.80 CPI via Google Play, the equivalent PWA CPI often lands around $0.65–0.67 — a 15–20% improvement in acquisition efficiency. When your Meta CPMs are already being pushed up by DST surcharges, recovering 15–20% on install efficiency is a meaningful offset. See the detailed analysis in this comparison of Android PWA vs Google Play install rate.
Revenue Retention
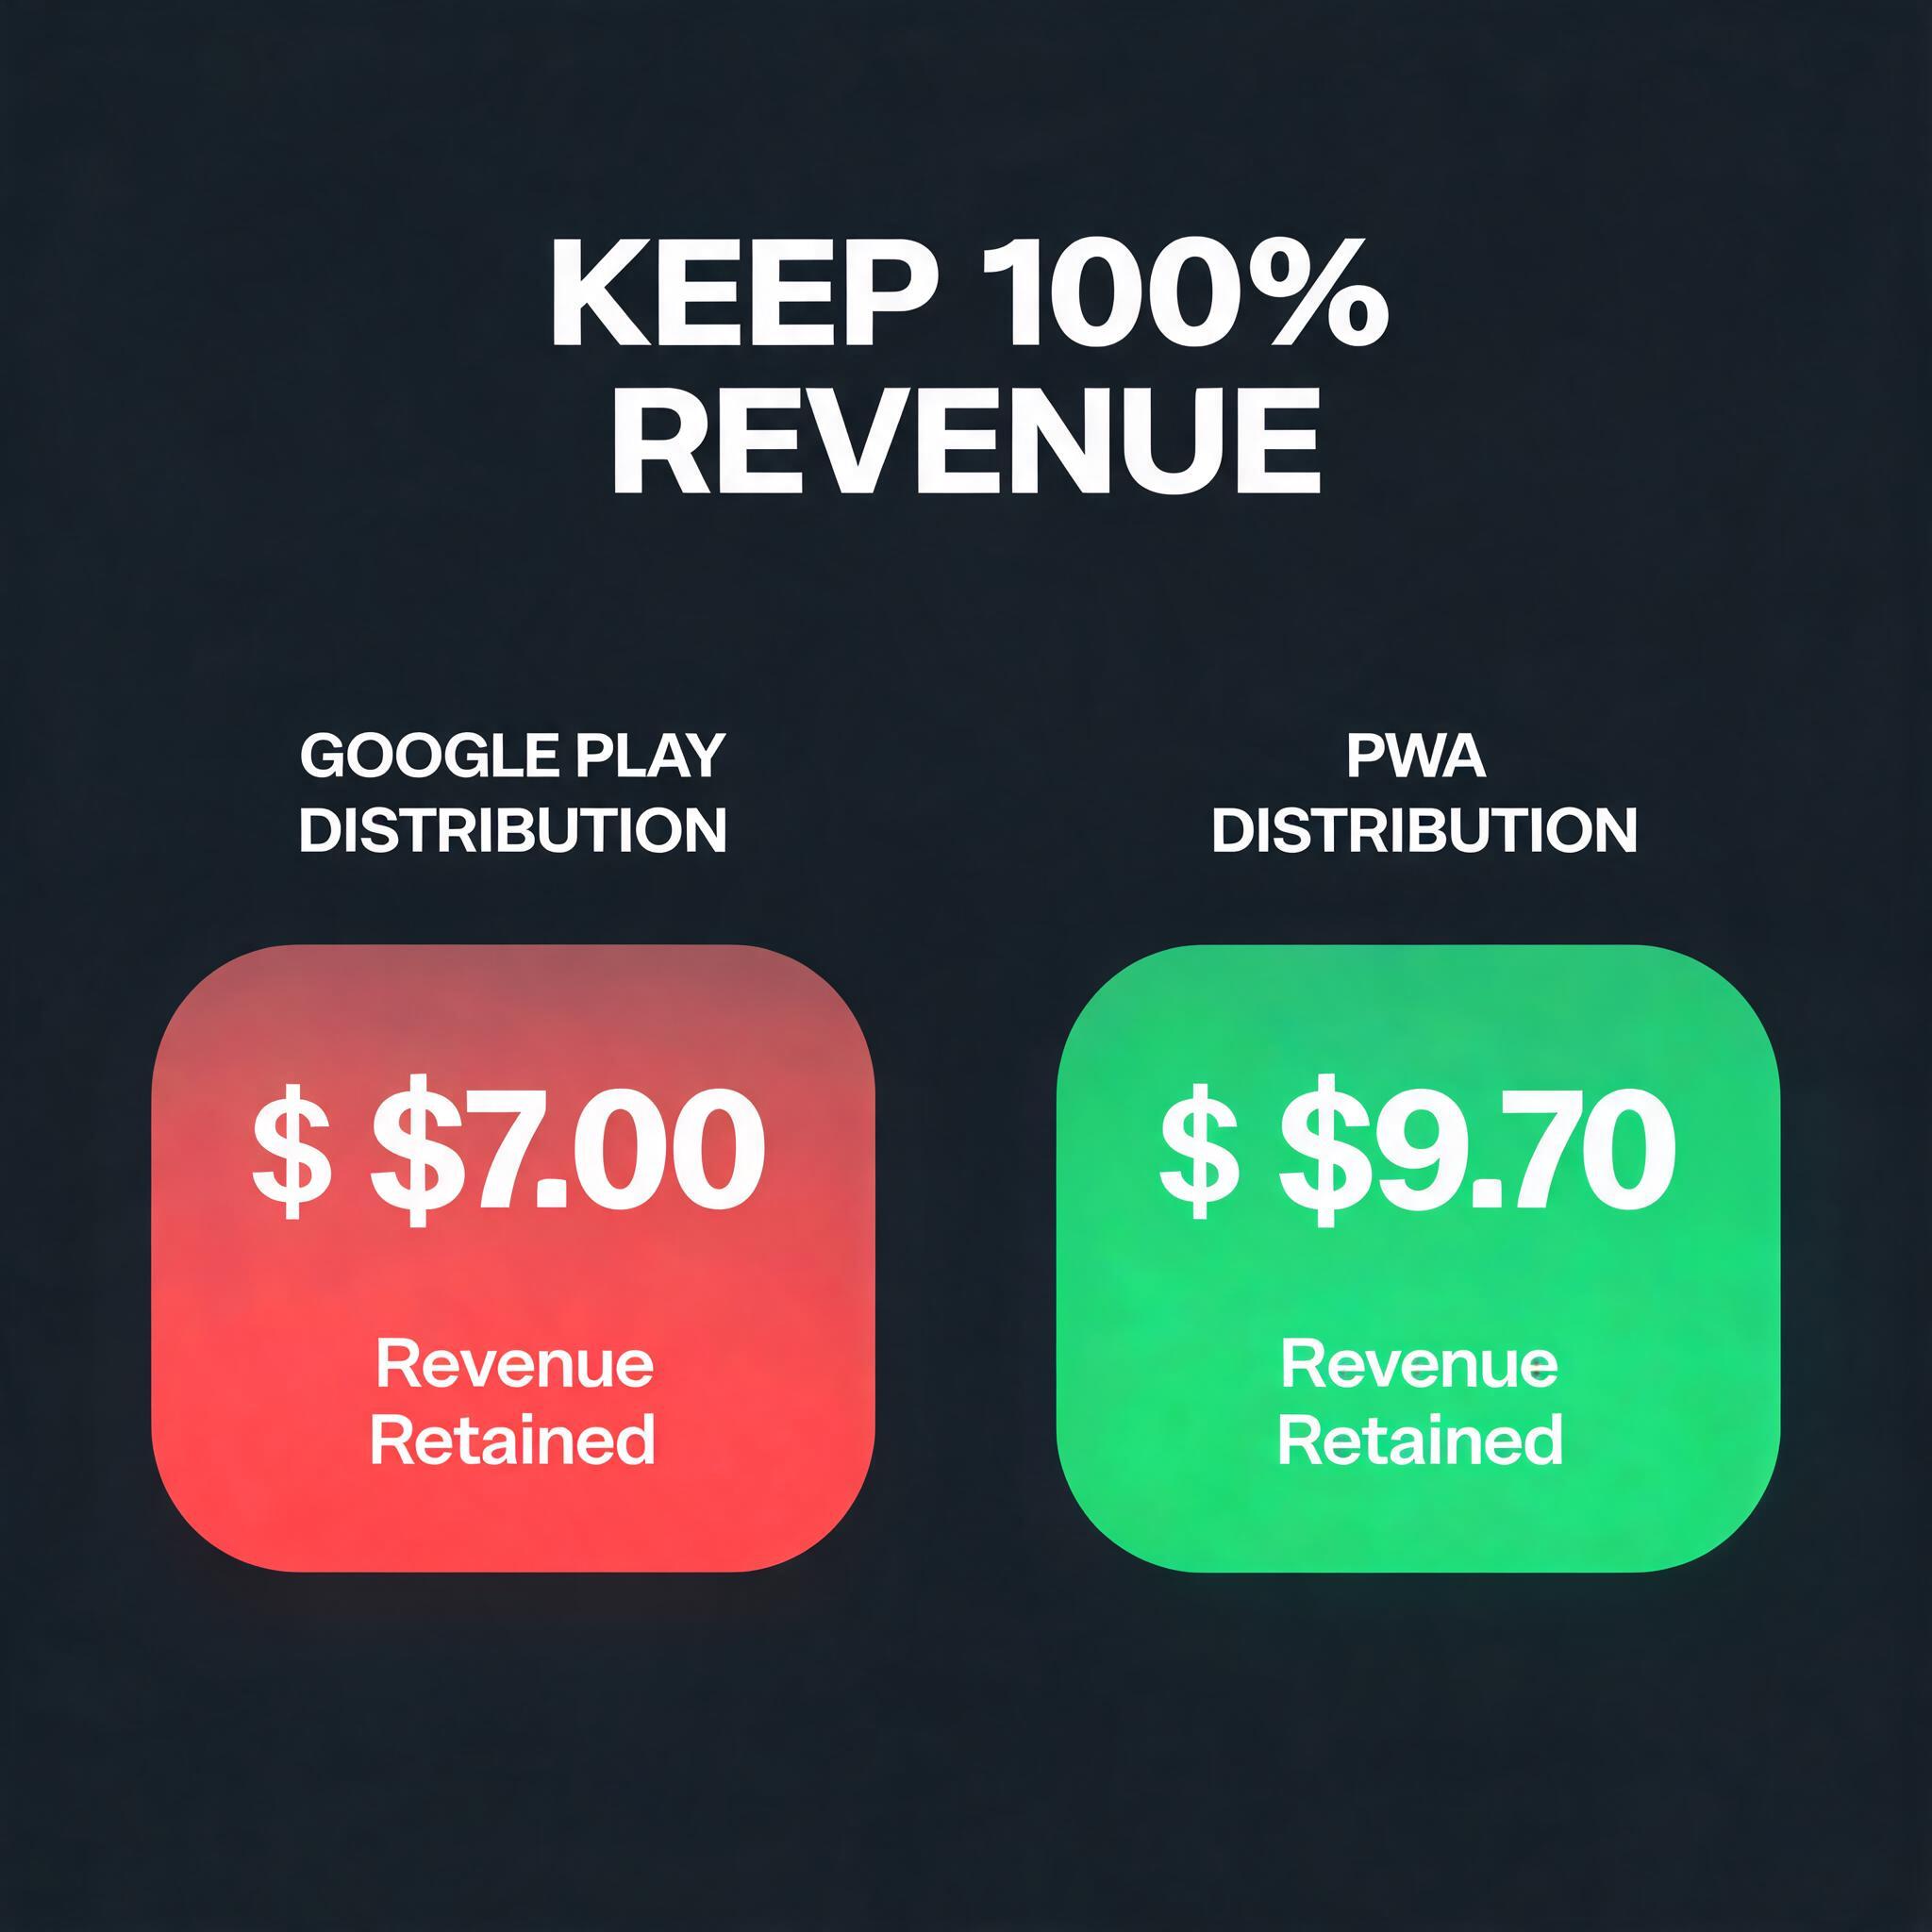
The revenue retention advantage is the most financially significant. Here’s a simplified unit economics comparison for a subscription app:
| Metric | Google Play Distribution | PWA Distribution |
|---|---|---|
| Monthly subscription price | $9.99 | $9.99 |
| Platform commission | $2.99 (30%) | ~$0.20–0.30 (payment processor only) |
| Revenue retained per subscriber | $7.00 | $9.70–9.80 |
| Revenue retained at 1,000 subscribers | $7,000/mo | $9,700–9,800/mo |
At 1,000 subscribers, PWA distribution recovers approximately $2,700–2,800 per month that would otherwise go to Google. That’s roughly the same order of magnitude as the annual Meta DST surcharge cost for a mid-size European campaign — meaning the commission savings alone can offset the tax increase.
Total Acquisition Cost Modeling
When you model the combined cost of acquisition + monetization on a per-user basis, the PWA path typically comes out 25–35% lower in total cost per monetized user. This accounts for:
- Higher install conversion rate (lower effective CPI)
- Elimination of Play Store commission on in-app revenue
- Reduced operational overhead (no store review cycles)
For teams spending $30,000–$100,000/month on European acquisition, this is a cost reduction that justifies a strategic distribution shift. The Meta DST surcharge adds urgency, but the economics hold even without it.
To understand how PWA fits into broader budget allocation decisions, the guide on Google PMax PWA budget optimization covers how teams are adjusting their channel mix in 2026.
Common Concerns: “Is PWA Right for Our App?”
When app operators first encounter the PWA distribution model, several questions come up consistently. Here are the honest answers:
“Will our users actually accept a PWA install?”
Yes — and in many markets, at higher rates than Play Store installs. The “add to home screen” flow is familiar to most smartphone users and requires less commitment than navigating an app store. User acceptance data from teams that have made the switch consistently shows no meaningful drop in install completion rate, and in many cases an improvement. The key variable is landing page design and the clarity of the install prompt — both of which are controllable by your team.
“What about app features — can a PWA do everything our native app does?”
For the majority of app categories — utility apps, subscription content, fintech tools, e-commerce, gaming — the answer is yes for the features that drive user acquisition and monetization. PWAs support offline functionality, push notifications, camera access, geolocation, and home screen installation. The ROiBest platform handles the packaging and capability configuration; your team doesn’t need to manage the technical complexity.
“Is this just for small teams?”
No. The PWA distribution model scales with spend. Teams running $100,000+/month in paid acquisition are using it specifically because the unit economics improve with scale — the Play Store commission is a percentage of revenue, so it grows proportionally with success. A team generating $500,000/month in in-app revenue saves $150,000/month by eliminating the 30% commission. The larger you are, the more compelling the math.
“What happens with Google’s ad ecosystem — will PMax and UAC still work?”
Yes. Google’s ad products support PWA destination URLs the same way they support any web landing page. PMax campaigns, UAC-equivalent web campaigns, and remarketing all function normally. You’re not giving up Google’s ad network by leaving Google Play — you’re just removing the final step where Google takes a revenue cut.
“How long does it take to switch?”
With ROiBest, the typical timeline from decision to live PWA is days, not months. ROiBest handles the packaging, configuration, and launch — your team defines the user flow, branding, and product logic. There’s no app store submission waiting period, no review queue, and no technical team requirement on your side.
Summary: Three Steps to Start Reducing Your Real Costs
If the Meta DST surcharges have prompted you to take a harder look at your total cost structure, here’s a practical starting framework:
- Model your current combined cost. Add up your Meta DST surcharge exposure (apply the relevant country rate to each market’s spend) and your current Google Play commission on in-app revenue. This is your baseline “platform tax” — the real cost you’re paying on top of actual acquisition spend.
- Run a PWA parallel deployment. Rather than migrating everything at once, launch a PWA version alongside your Play Store app and run it as a separate channel in your paid acquisition campaigns. Compare CPI, install conversion rate, and revenue per user side by side over 30–60 days. The data will make the distribution decision for you.
- Engage ROiBest to handle the technical layer. The business case is clear; the operational question is how fast you can execute. ROiBest is purpose-built to take app teams from decision to live PWA without requiring in-house PWA development expertise. The process is a partnership, not a technical project — your team sets the business requirements, ROiBest delivers the working distribution channel.
The Meta DST surcharge is a signal, not just a cost. It’s telling you that relying on platform intermediaries — ad networks, app stores — for every step of user acquisition and monetization is becoming structurally more expensive. The teams that respond by owning more of their distribution stack will have a durable cost advantage going into the second half of 2026 and beyond.
Skip the app store. Go live instantly, keep 100% of your revenue.
ROiBest helps Android app teams launch PWAs — no review process, no 30% Google Play cut, and push notifications that work even after uninstall. Teams see up to 1.2x higher install conversion rates vs native app downloads.

留下评论