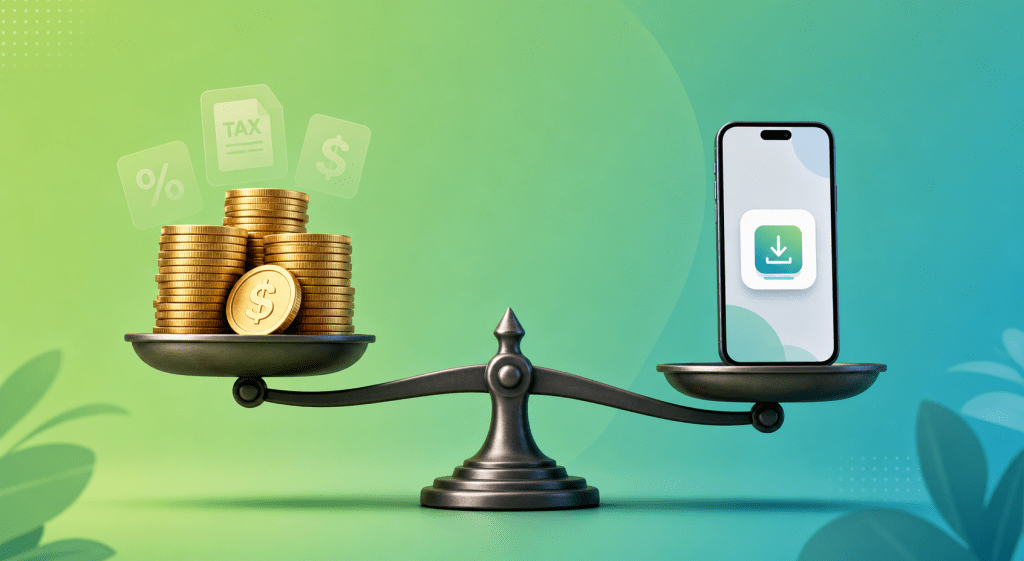
Meta started charging digital services tax surcharges in multiple countries in 2024 and expanded the list further in 2025 and into 2026. The surcharges range from 2% to 7% on top of existing ad spend, depending on the market. According to Meta’s own advertiser documentation, these fees now apply across at least 11 countries, including the UK (2%), France (3%), Turkey (7.5%), and Spain (3%) (Meta Business Help Center, 2025). For cross-border app teams buying Meta traffic at scale, those percentage points compound fast.
But the tax surcharge isn’t the only cost climbing. App teams distributing through Google Play already surrender 15-30% of in-app revenue to platform fees. When you stack rising ad costs on top of distribution commissions, the math gets uncomfortable. A team spending $100,000/month on Meta ads in France now pays an extra $3,000 just in tax surcharges — before a single user even reaches the app. And when that user installs through Google Play, another 15-30% of the revenue they generate goes to Google.
There’s a structural way to offset the rising costs. PWA distribution removes the app store from the equation entirely. No Google Play commission. No store redirect. No download friction. You keep the revenue that would otherwise subsidize platform fees, which directly absorbs the impact of Meta’s new surcharges. This article breaks down what the tax means for your ad budget, how the double cost burden hits app teams hardest, and how PWA distribution changes the economics.
→ Want to bypass Google Play entirely? See how ROiBest PWA works — no submission, no cut, 1.2x installs.
TL;DR: Meta’s digital services tax surcharges add 2-7.5% to ad costs across 11+ countries (Meta Business Help Center, 2025). For app teams also paying Google Play’s 15-30% commission, the combined cost pressure is significant. PWA distribution eliminates the store commission entirely, offsetting the rising ad costs and keeping more revenue in your business.
For a broader look at why teams are moving away from Google Play, see our Google Play alternative distribution guide.
What Is Meta’s Digital Services Tax Surcharge?
It’s a pass-through fee Meta adds to your ad bill to cover local digital services taxes. As of mid-2026, Meta applies surcharges in at least 11 countries and territories, with rates ranging from 2% (UK, South Africa) to 7.5% (Turkey) (Meta Business Help Center, 2025). These aren’t new taxes on Meta. They’re taxes governments impose on digital platforms, which Meta then passes directly to advertisers. You pay the tax. Meta simply collects it.
Which Countries Are Affected?
The list keeps growing. As of early 2026, Meta’s digital services tax surcharges apply in the United Kingdom (2%), France (3%), Spain (3%), Italy (3%), Austria (5%), Turkey (7.5%), Kenya (1.5%), South Africa (2%), Nigeria (6%), India (2%), and Canada (3%). Several additional markets are expected to join as more countries implement digital services tax legislation. For teams running cross-border campaigns to multiple markets simultaneously, the weighted average surcharge across a typical multi-country campaign can reach 3-4%.
Why Is This Happening Now?
Digital services taxes gained momentum after the OECD’s Pillar One negotiations stalled in 2023-2024. Countries that couldn’t reach a multilateral agreement started acting unilaterally. The OECD identified over 60 countries that had implemented or were actively developing digital services tax measures by early 2025 (OECD, 2025). As more governments enact these taxes, platforms like Meta, Google, and Amazon pass the cost downstream. For advertisers, this is a permanent cost increase, not a temporary adjustment.
How Does the Tax Hit Cross-Border App Teams Hardest?
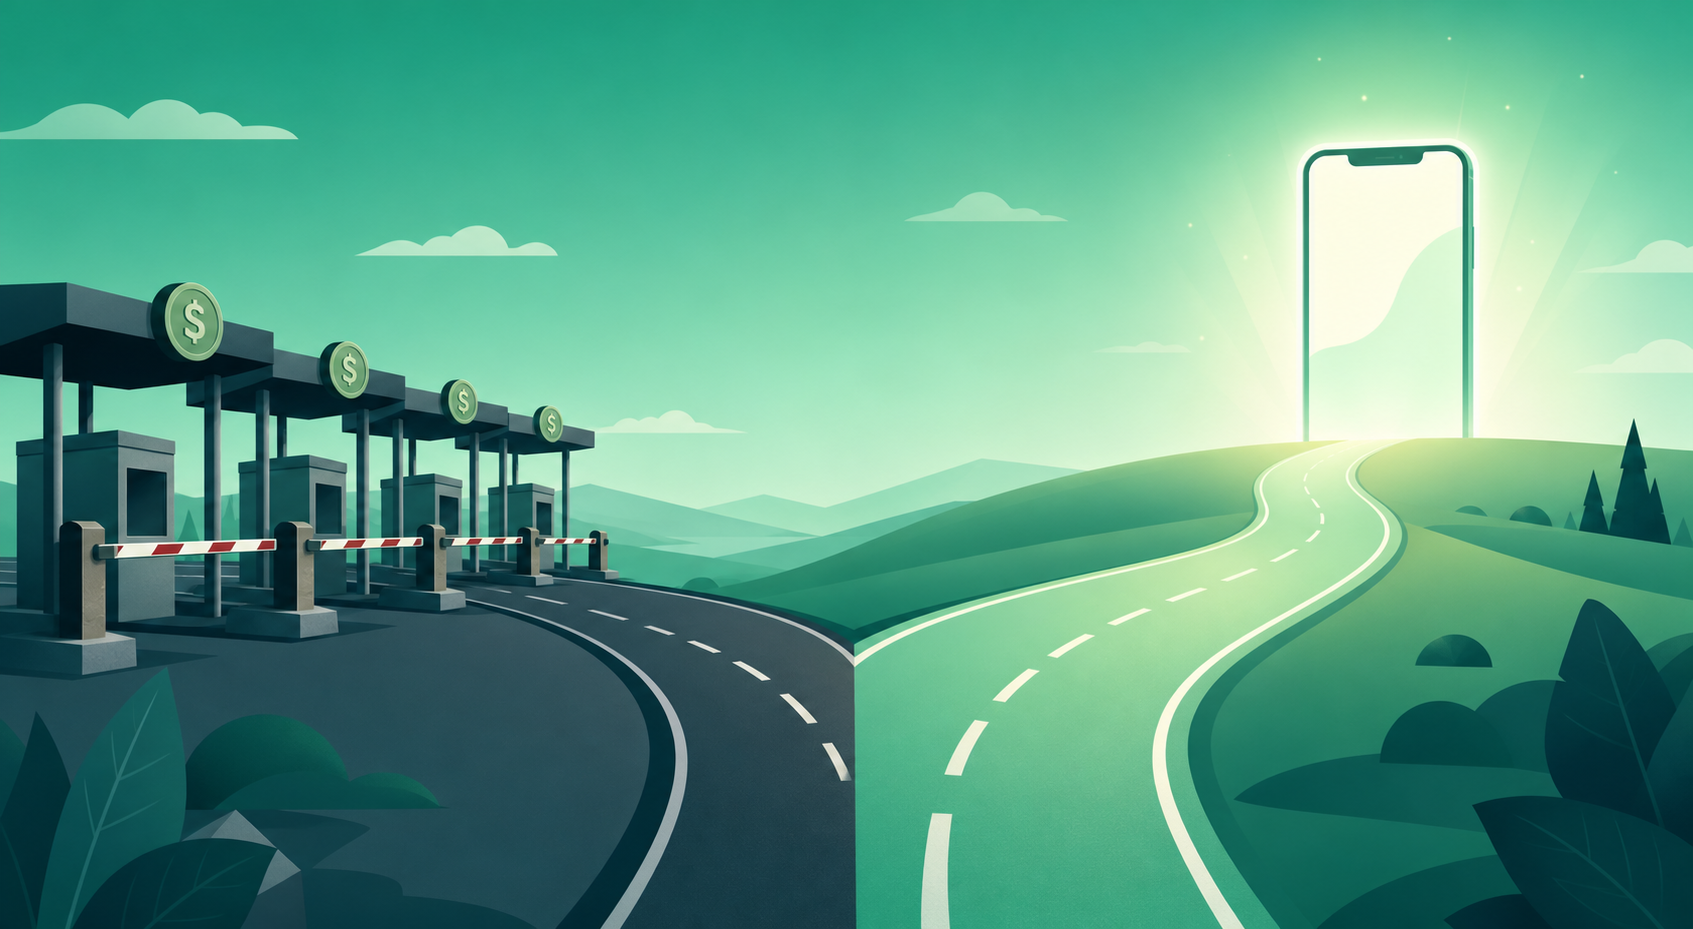
Cross-border app teams face a compounding cost problem that domestic businesses don’t. A 2025 Appsflyer report found that the average cost per install (CPI) for app campaigns on Meta rose 18% year-over-year globally, reaching $3.50 for Android app install campaigns in competitive verticals (AppsFlyer, 2025). Layer Meta’s DST surcharges on top of that CPI increase, and then add Google Play’s 15-30% commission on whatever revenue those users generate. The margins get thin.
The Double Burden: Rising Ad Costs + Platform Commission
Here’s the specific pain point. An app team targeting users in France, the UK, Spain, and Turkey through Meta ads now pays an incremental 2-7.5% on ad spend just for DST surcharges. On a $200,000 monthly Meta budget spread across these markets, that’s roughly $6,000-$8,000 in additional tax fees per month. That’s money that buys zero additional installs.
Then there’s the second layer. Every user who installs through Google Play and makes an in-app purchase generates revenue that’s taxed again — not by a government, but by the platform. Google takes 15% on the first $1 million in annual revenue, and 30% above that. For an app generating $500,000/month in subscriptions, that’s $75,000-$150,000 going to Google per month.
Stack both costs. The team pays more to acquire each user (rising CPI + DST surcharges) and then keeps less from each user who pays (Google Play commission). The squeeze is real. And it’s structural — these aren’t costs you can optimize away with better creative or sharper targeting.
Where Does the Money Actually Go?
Let’s trace a dollar through the system. You spend $1.00 on a Meta ad targeting France. Meta adds 3% DST — you actually pay $1.03. That ad generates a click, and the user lands on a Google Play listing. Google Play converts roughly 33% of listing visitors to installs (StoreMaven, 2025). So your effective cost per install from that click isn’t just CPI — it’s CPI adjusted for store conversion loss.
The user installs, subscribes, and pays $10/month. Google takes $1.50-$3.00 per month from that subscription. Over 6 months, you’ve paid $6.18 to acquire the user (adjusted CPI with DST), and Google has taken $9-$18 of the user’s $60 in payments. Your total platform overhead on a single user: $15-$24 out of $60 in gross revenue. That’s 25-40% gone before you pay for servers, support, or payroll.
How Does PWA Distribution Offset Rising Meta Ad Costs?
PWA distribution eliminates the largest controllable cost in the equation: the app store commission. Google Web.Dev data shows PWA installs complete in under 3 seconds on average, compared to 15-45 seconds for native app downloads (Google Web.Dev, 2025). But the speed advantage is secondary. The primary financial advantage is that PWA distribution removes Google Play from the revenue path entirely. Zero commission. Zero platform cut. Every dollar a user spends stays in your business.
Eliminating the 15-30% Commission
This is the most direct offset. An app generating $500,000/month through Google Play loses $75,000-$150,000 to platform commissions. Switch to PWA distribution, and that money stays in your P&L. On an annual basis, that’s $900,000-$1,800,000 — vastly more than the incremental cost of Meta’s DST surcharges.
Put it differently. If your total Meta DST surcharge across all markets is $8,000/month, but you save $100,000/month by eliminating the Google Play cut, you’ve more than offset the rising ad costs. You haven’t just absorbed the tax increase — you’ve fundamentally improved your unit economics. The commission savings dwarf the DST increase by an order of magnitude for most app businesses.
Higher Install Conversion Rates
PWA also reduces waste in your ad funnel. When you send Meta ad traffic to Google Play, about one-third of visitors actually install (StoreMaven, 2025). Two-thirds of your paid traffic bounces. With PWA, the install prompt appears directly on your landing page. No store listing to browse. No competing apps to distract. No download wait time. Teams report install conversion rates up to 1.2x higher than Google Play.
Higher conversion means lower effective CPI. If your raw CPI from Meta is $3.50 and the DST adds 3%, you’re paying $3.61 per click. Through Google Play (33% conversion), your cost per install is roughly $10.94. Through PWA (with 1.2x higher conversion), your cost per install drops to approximately $9.11. That 17% reduction in effective CPI partially neutralizes the DST surcharge impact by itself — and the commission savings handle the rest.
For teams already running Google Ads alongside Meta, our guide to Google PMax channel PWA distribution shows how the same PWA approach works across ad platforms.
What Does the Cost Comparison Look Like in Practice?
Real numbers make the case clearer. Wordstream data shows the average CPI for app install campaigns on Google and Meta combined was $2.40-$3.50 in 2025, but the cost per engaged user (those completing a first session) reached $5.80-$8.20 depending on vertical (Wordstream, 2025). The gap between install cost and engaged user cost is where PWA distribution delivers the biggest impact.
Scenario: $100,000/Month Meta Spend Across DST Markets
Google Play distribution path:
- Meta ad spend: $100,000
- DST surcharges (avg. 3.5%): +$3,500
- Total ad cost: $103,500
- CPI at $3.50 → ~29,571 installs
- Install-to-session rate: ~65% → ~19,221 engaged users
- Cost per engaged user: $5.38
- Monthly app revenue: $200,000
- Google Play commission (15-30%): -$30,000 to -$60,000
- Net revenue after commission: $140,000-$170,000
PWA distribution path:
- Meta ad spend: $100,000
- DST surcharges (avg. 3.5%): +$3,500 (same — DST still applies)
- Total ad cost: $103,500
- 1.2x higher install conversion → ~35,485 installs
- Install-to-session rate: ~90% → ~31,937 engaged users
- Cost per engaged user: $3.24
- Monthly app revenue: $200,000
- Platform commission: $0
- Net revenue: $200,000
Same ad budget. Same DST surcharges. But 66% more engaged users and $30,000-$60,000 more in retained revenue per month. Over a year, that gap is $360,000-$720,000. The DST surcharge cost ($42,000/year) is a rounding error compared to the commission savings.
[CHART: Side-by-side bar chart — Google Play vs PWA distribution: engaged users (19,221 vs 31,937), cost per engaged user ($5.38 vs $3.24), annual commission paid ($360K-$720K vs $0) — Source: Compiled from Meta Business Help, Wordstream, StoreMaven 2025]
How Should App Teams Respond? 3 Action Steps
The transition doesn’t require pausing campaigns or rebuilding your app. Google’s Web Platform team reported that median migration time from native Android to PWA is 2-4 weeks with an experienced partner (Google Web.Dev, 2025). Here’s the practical path for teams facing DST cost pressure.
Step 1: Calculate Your True All-In Cost Per User
Pull your Meta ad spend data for the last 90 days. Add up CPI, DST surcharges by market, and Google Play commissions on the revenue those users generated. Divide total costs by actual engaged users (not attributed installs — real first sessions). This number is your all-in cost. If it’s more than 40% of your LTV per user, your current distribution model isn’t sustainable as DST rates keep climbing.
Step 2: Launch PWA Distribution Through a Partner
A PWA launch partner handles the install experience, push notification setup, and performance optimization. Your team stays focused on the product. The result is a production-ready PWA that users install directly from a landing page you control. No app store submission. No review delays. No revenue sharing. Don’t pull your engineering team off the product to build distribution infrastructure — that’s not where your competitive edge sits.
Step 3: Run a Parallel Test for 14 Days
Keep your Google Play campaign running. Launch a second campaign pointing Meta traffic to your PWA install page. Same creative. Same audience. Same budget split. After two weeks, compare install rates, first-session rates, Day-1 retention, and net revenue per user (after commissions). The data almost always makes the decision obvious. Teams running this test consistently find that the commission savings alone justify the switch — even before factoring in higher install conversion.
Teams exploring content-driven acquisition alongside Meta ads will find that TikTok algorithm and PWA distribution creates another avenue for reducing dependence on paid channels as ad costs rise.
What About Common Concerns?
PWA adoption among top Android apps reached 17.3% in Q1 2026, up from 11% in 2024 (AppScope PWA Index, 2026). The technology is proven, but teams still raise practical questions. Here are the ones most relevant to the DST cost discussion.
“Won’t users be confused by installing outside Google Play?”
No. The user taps your ad, lands on your page, and the browser shows a native install prompt. One tap, and the app icon appears on their home screen. It opens full-screen and sends push notifications just like a native app. Most users can’t tell the difference. And they don’t need to — what matters is that the app works.
“Does Meta allow PWA landing pages for app campaigns?”
Yes. Meta’s ad policies accept any landing page that meets quality standards. You’re not violating any policy by sending traffic to a web-based install experience instead of a Google Play listing. The ad still runs through Meta’s system, DST still applies to your ad spend, but you’ve removed the Google Play commission from the revenue side.
“Can I still send push notifications with PWA?”
Android has supported web push notifications since 2015. PWA push notifications look and behave identically to native ones. There’s even an advantage: push subscriptions persist in the browser even if the user removes the PWA from their home screen. You can re-engage users who’ve “uninstalled” — something native apps can’t do.
“Is this just avoiding the problem instead of solving it?”
It’s solving a different problem. You can’t control whether governments impose digital services taxes. You can’t control whether Meta passes those costs to advertisers. But you can control how much of your revenue goes to app store commissions. Removing the 15-30% Google Play cut is a decision within your control, and it more than compensates for the 2-7.5% DST increase.
Frequently Asked Questions
What is Meta’s digital services tax surcharge?
It’s a fee Meta adds to advertiser bills to cover local digital services taxes imposed by governments. Rates range from 2% (UK) to 7.5% (Turkey), and the surcharge now applies in at least 11 countries as of 2026. Meta passes 100% of the cost to advertisers — it’s not a tax Meta absorbs.
How much does the DST surcharge add to my Meta ad budget?
It depends on your target markets. A team spending $100,000/month across France (3%), UK (2%), Spain (3%), and Turkey (7.5%) would pay roughly $3,000-$4,000 in additional DST surcharges monthly. As more countries adopt digital services taxes, this number will grow. The OECD identified over 60 countries developing DST measures as of 2025.
Can PWA distribution really offset rising ad costs?
Yes, because the savings from eliminating Google Play’s 15-30% commission far exceed the incremental DST cost. A team paying $8,000/month in DST surcharges but saving $100,000/month in store commissions comes out significantly ahead. PWA also improves install conversion rates by up to 1.2x, further lowering effective CPI.
Does switching to PWA mean I stop using Meta ads?
Not at all. You continue running Meta campaigns exactly as before. The DST surcharge still applies to your ad spend. The difference is where the ad traffic lands. Instead of Google Play, users arrive at your PWA install page. Same ads, same budget, same audiences — but no store commission on the revenue side.
How long does it take to switch from Google Play to PWA distribution?
With an experienced PWA launch partner, the median migration time is 2-4 weeks according to Google’s Web Platform team. You don’t need to rebuild your app. The partner handles the PWA install experience, push notifications, and performance tuning. Your team stays focused on the product.
Skip the app store. Go live instantly, keep 100% of your revenue.
ROiBest helps Android app teams launch PWAs — no review process, no 30% Google Play cut, and push notifications that work even after uninstall. Teams see up to 1.2x higher install conversion rates vs native app downloads.
 WebApp中文站
留下评论