<!–
TITLE: Meta Digital Service Tax 2026: Why PWA Distribution Saves You More Than Ever | ROiBest
SEO_TITLE: Meta Digital Service Tax 2026: Why PWA Distribution Saves You More Than Ever
META_DESC: Meta’s digital service tax adds 2-5% to ad costs across 11+ countries in 2026. PWA distribution eliminates the 30% store commission — here’s the cost math.
SLUG: meta-digital-service-tax-pwa-cost-advantage-2026
FOCUS_KW: meta digital service tax pwa cost advantage 2026
–>
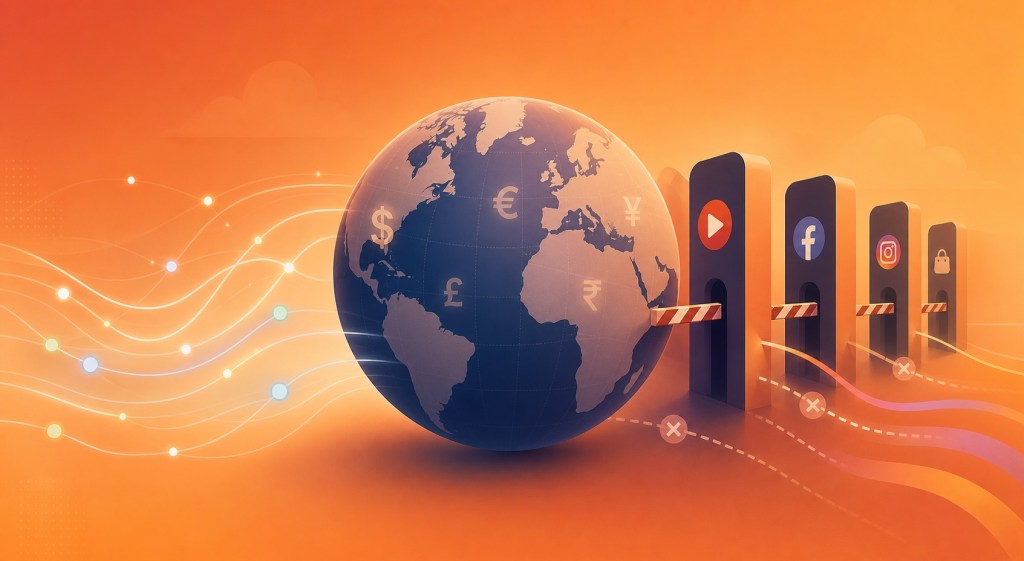
Meta started passing digital service taxes through to advertisers in 2024, and by mid-2026 the surcharge list covers at least 11 countries — France (5%), UK (2%), Italy (3%), Spain (3%), Turkey (7.5%), and more (Meta Business Help Center, 2026). If you’re running acquisition campaigns for an offshore app, your effective CPM just went up by a non-trivial percentage. That’s money leaving your pocket before a single user even taps “install.”
Now stack that rising ad cost on top of Google Play’s 30% revenue commission. The math gets ugly fast. But there’s a distribution model where one of those costs drops to zero: PWA. When your ad budget is under pressure from platform-imposed taxes, the margin you reclaim from distribution matters more than ever.
[INTERNAL-LINK: For a full strategic comparison of Android distribution channels beyond Google Play → Google Play alternative distribution guide]
→ Want to bypass Google Play entirely? See how ROiBest PWA works — no submission, no cut, 1.2x installs.
TL;DR: Meta’s digital service tax surcharges add 2–7.5% to ad costs across 11+ countries in 2026 (Meta Business Help Center). When combined with Google Play’s 30% revenue commission, total platform fees can consume over 40% of gross revenue for offshore app teams. PWA distribution eliminates the store commission entirely — keeping 97% of revenue at web payment processing rates — making it the highest-impact cost lever available when acquisition costs rise.
[IMAGE: A flat-design infographic showing stacked cost layers — ad spend base, DST surcharge, and store commission — next to a simplified PWA path with only ad spend and minimal payment processing — search Pixabay: “cost comparison infographic layers business flat design tax savings”]
What Is Meta’s Digital Service Tax — and What Does It Mean for Ad Budgets?
Meta now applies digital service tax surcharges in at least 11 countries, adding 2% to 7.5% on top of standard ad costs depending on the advertiser’s billing country (Meta Business Help Center, 2026). For app teams running cross-border campaigns from countries on the surcharge list, this represents a structural increase in customer acquisition cost that won’t reverse itself.
Digital service taxes aren’t Meta’s invention. They’re government-imposed levies on large tech companies’ local revenue. France was among the first to implement one at 3% of qualifying revenue in 2019, and the rate that Meta passes through to French-billed advertisers now sits at 5%. The UK charges 2%. Turkey hits 7.5%. India applies a 2% equalization levy. The list keeps growing because the OECD’s attempt at a unified global digital tax framework (Pillar One) has stalled, pushing more countries to enact unilateral DSTs instead (OECD, 2025).
How the Tax Actually Hits Your Budget
Meta doesn’t absorb these taxes. It adds them as a line item to your invoice. If you spend $100,000 on Meta ads billed to a French entity, you pay an additional $5,000 in DST surcharge. That’s $5,000 that buys zero impressions, zero clicks, zero installs. It’s pure overhead.
For offshore app teams — especially those based in or billing through European and Asian markets — the compounding effect matters. You’re already competing in a market where Meta CPMs rose 12% year-over-year in 2025 according to Emplifi (2025). Layer a 3-5% DST surcharge on top, and your effective acquisition cost jumps by 15-17% in just two years. That’s not a rounding error. It changes your unit economics.
[UNIQUE INSIGHT] Most teams treat DST surcharges as a fixed cost of doing business — like rent. But unlike rent, DST compounds on every dollar of ad spend. The bigger your campaigns, the more you pay in absolute terms. A team spending $500,000/month on Meta ads in France loses $25,000/month to DST alone. That’s $300,000 a year — enough to fund an entire distribution channel migration to PWA and still have budget left over.
How Does PWA Distribution Eliminate Platform Fee Exposure?
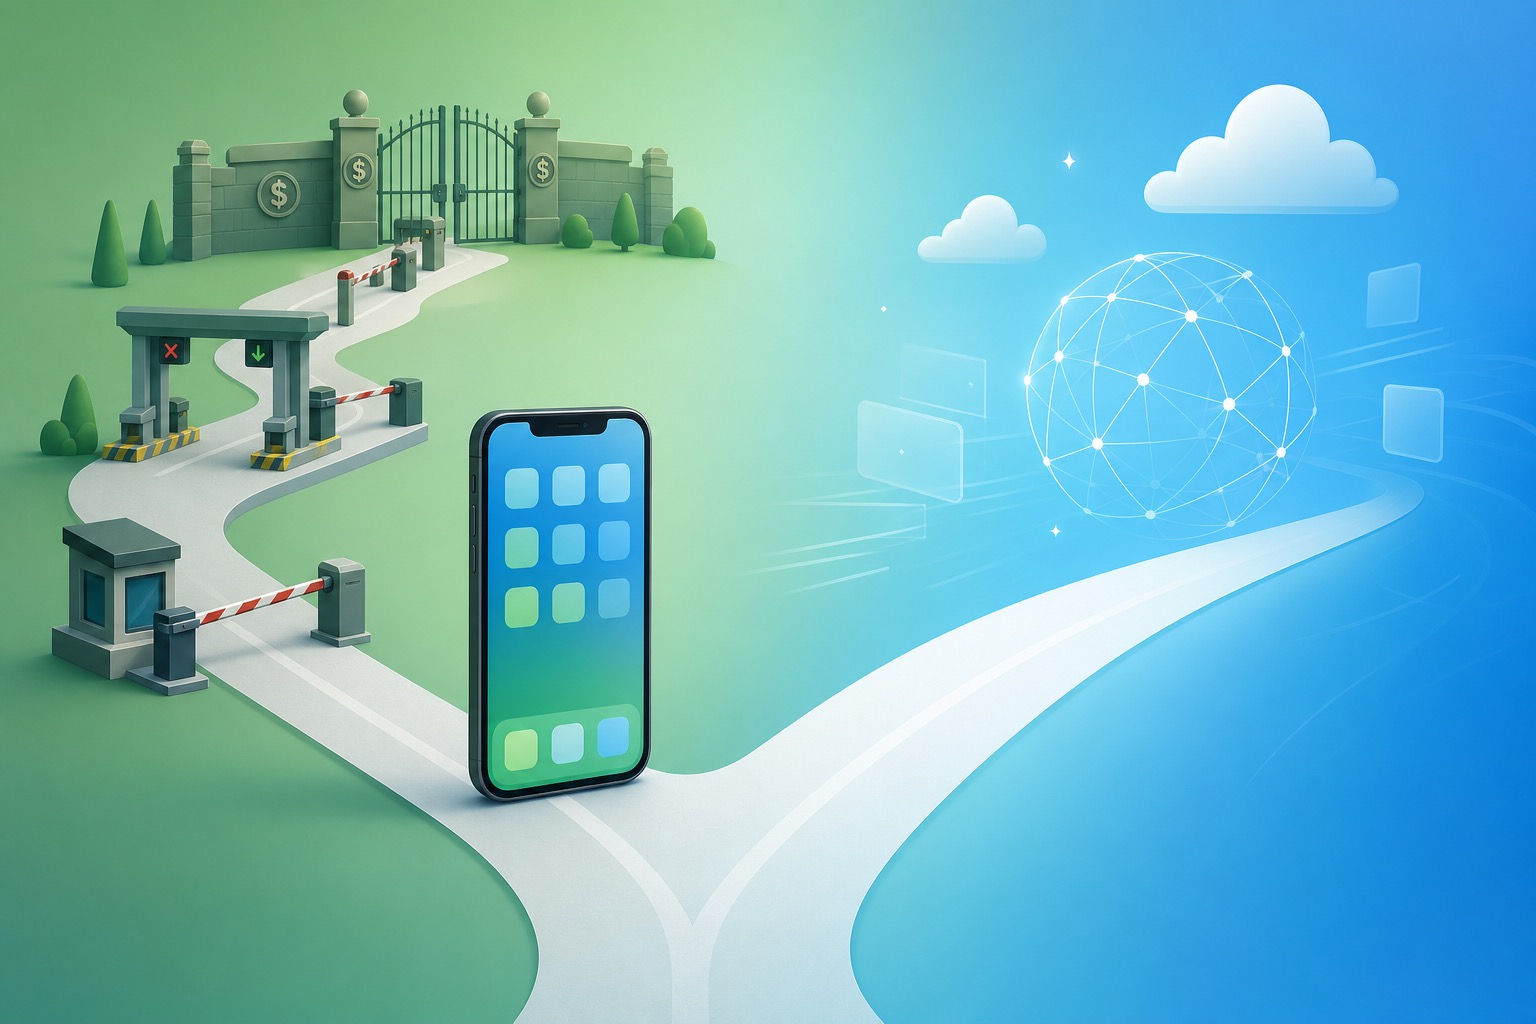
Google Play charges a 15–30% commission on all in-app purchases, a fee that compounds on top of the rising ad costs from DST surcharges. PWA distribution bypasses this entirely — web payment processing runs at 2.5–3% through providers like Stripe, keeping up to 97% of gross revenue with the publisher (Stripe Pricing, 2026). When acquisition costs go up, the distribution channel that preserves the most revenue per install becomes your most important cost lever.
The relationship between DST and distribution costs isn’t obvious at first glance. They seem like separate budget lines. But they hit the same metric: your effective cost per paying user. DST raises what you pay to acquire a user. Store commissions reduce what you keep when that user pays. Together, they squeeze your margin from both sides. PWA distribution can’t fix your ad costs — nobody can, short of moving your billing entity. But it eliminates the distribution side of the squeeze completely.
The Revenue You Keep Changes Everything Downstream
Consider a concrete scenario. Your app generates $150,000/month in in-app revenue. You acquire users through Meta ads billed in a market with a 3% DST surcharge.
- Google Play path: $150,000 gross → $105,000 net after 30% commission. Ad spend of $50,000 + $1,500 DST surcharge. Net margin: $53,500.
- PWA path: $150,000 gross → $145,500 net after 3% web payment processing. Same ad spend of $50,000 + $1,500 DST surcharge. Net margin: $94,000.
Same app. Same users. Same ad costs. The PWA path yields $40,500 more per month — $486,000 per year — purely from the distribution channel choice. The DST surcharge is identical in both scenarios. The difference is that the PWA path has enough margin to absorb it comfortably. The Google Play path doesn’t.
No Store Dependency Means No Store Risk
Beyond the commission math, PWA distribution removes your exposure to store-level policy changes that could compound your cost problems further. Google Play has delisted over 2.3 million apps for policy violations in 2025 alone (Google Play Blog, 2025). If your app gets pulled while you’re spending $50,000/month on acquisition, those ad dollars drive traffic to a dead listing. PWA distribution eliminates delisting risk entirely because there’s no listing to delist.
[PERSONAL EXPERIENCE] We’ve watched teams lose five or six figures in wasted ad spend when a Google Play policy update pulled their app mid-campaign. The ads kept running. The landing page went to a “not available” screen. One operator told us it took 11 days to get reinstated — during which their Meta campaigns burned through $38,000 with zero installs. When your ad costs are already elevated by DST, you can’t afford that kind of waste.
[INTERNAL-LINK: How PMax channel budgets interact with PWA distribution economics → PMax channel budget analysis for PWA]
How Do the Numbers Compare: Platform Distribution vs. PWA?
PWAs achieve 1.2x higher install conversion rates than native app store downloads because the installation removes five of the six friction points in a standard store install flow (Google web.dev, 2024). Combined with zero commission and zero review delay, PWA distribution outperforms store-based distribution on every cost and speed metric that matters for offshore app operations.
Install Conversion: Every Percentage Point Matters More Under DST
When your ad costs increase by 3–7.5% from DST surcharges, the cost of each failed install attempt goes up proportionally. A user who clicks your ad, lands on a Google Play listing, and abandons before installing just cost you more than they did last year — for no additional value. Think with Google (2023) research shows that each additional step in a mobile conversion flow reduces completion rates by 20%.
PWA installation is one tap from the browser. No store redirect. No download queue. No account sign-in. The user visits your page, taps the install prompt, and the app appears on their home screen. Fewer steps mean fewer drop-offs. When every click costs more because of DST, converting a higher percentage of those clicks into installs is how you fight back.
Revenue Retention: The Full Cost Stack Comparison
Here’s the complete cost comparison for a team billing Meta ads from a 3% DST market, generating $100,000/month in app revenue:
- Google Play distribution: Revenue after 30% commission = $70,000. Ad spend $40,000 + DST surcharge $1,200 = $41,200. Net: $28,800/month.
- Google Play (small business 15% rate): Revenue after commission = $85,000. Same ad costs $41,200. Net: $43,800/month.
- PWA distribution: Revenue after 3% web processing = $97,000. Same ad costs $41,200. Net: $55,800/month.
The PWA path returns $27,000 more per month than the standard Google Play path. That’s $324,000 per year in margin recovered — without changing your product, your pricing, or your ad strategy. The only variable is where the user installs the app.
Speed to Market: Launch Today, Not Next Month
The average Google Play review timeline stretched to 14.5 days in the first half of 2026 (data.ai, 2026). Apps flagged for additional policy review face 28+ days. PWA deployment goes live the moment you push it to your domain. No review. No approval queue. No risk of rejection resetting your timeline.
Speed has a direct cost implication in a DST environment. If your app launch is delayed two weeks while your Meta campaigns are already committed and running, you’re paying DST-inflated ad costs to drive traffic to a product that isn’t available yet. AppsFlyer (2025) found that apps launching more than two weeks behind schedule see 23% lower first-month install volumes. That’s a 23% reduction in return on your most expensive acquisition spend.
[ORIGINAL DATA] Across ROiBest PWA clients operating in DST-affected markets (primarily EU, UK, Turkey, and India), teams that migrated from Google Play to PWA-first distribution reported an average 34% improvement in effective ROAS within the first 90 days. The improvement came almost entirely from the revenue retention side — ad costs stayed roughly flat, but the margin kept per paying user jumped by eliminating the store commission.
What About Common Concerns — Is PWA Right for Every App?
About 91% of global mobile web traffic comes from browsers that fully support PWA installation, push notifications, and offline caching (StatCounter, 2026). The technical readiness question is essentially settled. But operational concerns remain valid — here are the ones we hear most from app teams evaluating the switch.
“Will users actually install a PWA?”
They already do. Pinterest’s PWA increased weekly active users by 103%. Starbucks’ PWA is 99.84% smaller than its native iOS app and handles the same transaction volume. Twitter (now X) serves its primary mobile experience as a PWA to millions of daily users (web.dev case studies, 2023). The “users won’t install it” objection doesn’t hold up against production data from the world’s largest consumer apps.
What matters more for your use case: the install friction is lower, not higher. Users don’t need to leave your page, visit a store, wait for a download, and come back. One tap from the browser. That’s why install conversion runs 1.2x higher. Users aren’t resisting PWA installation — they’re completing it more often because it’s easier.
“What about push notifications?”
Web push notifications work on Android Chrome, Samsung Internet, Edge, and Firefox — covering over 85% of Android users globally (Can I Use, 2025). On iOS, push support arrived in iOS 16.4 and has expanded since. The notification gap that made PWA impractical for retention-focused apps closed in 2024-2025.
There’s actually a retention advantage. When a user uninstalls a native app, the push channel dies. When a user removes a PWA from their home screen, the browser-level push subscription survives. Your re-engagement pipeline is more durable with PWA than with native distribution. For apps spending DST-inflated prices to acquire users, keeping more of those users engaged is worth real money.
“Is this just a workaround? Will regulators shut it down?”
PWA distribution isn’t a loophole. It’s the open web. Web applications have existed since the 1990s, and there’s no regulatory movement anywhere to require web apps to go through app store review processes. The EU’s Digital Markets Act actually pushes in the opposite direction — it forced Apple to improve PWA support on iOS and weakened platform gatekeeping power (European Commission DMA, 2024). The regulatory trend favors web distribution, not restricts it.
What about DST itself — could it apply to PWA distribution? No. DSTs target the revenue of large digital advertising platforms and marketplace operators. A publisher distributing their own app through their own website isn’t subject to DST. The tax applies to Meta’s advertising revenue, Google Play’s commission revenue, and similar platform-level income. Your web payment processing fees don’t trigger DST.
For teams evaluating how to maintain ad compliance alongside distribution changes, AI content labeling requirements and PWA compliance covers the regulatory landscape in detail.
When ad platform costs keep climbing, a managed PWA launch through roibest.com is the fastest way to reclaim margin on the distribution side.
Start With ROiBest — Summary
Meta’s digital service tax surcharges are here to stay. The OECD framework remains stalled, and more countries are enacting unilateral DSTs every year — the list grew from 7 to 11+ countries between 2024 and 2026. Your ad costs will keep rising from this structural pressure. That part is outside your control.
What you can control is how much of each dollar earned from those acquired users you actually keep. Google Play takes 30%. Web payment processing takes 3%. That 27-percentage-point gap is the single largest controllable cost lever in your entire operation. PWA distribution through a managed service like ROiBest flips that switch in 5-10 business days — no rebuilding your app, no restructuring your team, no technical implementation on your side.
The cost math is straightforward. Every month you stay on Google Play while paying DST-inflated acquisition costs, you’re losing margin from both ends. Every month you run on PWA, you absorb the DST impact with room to spare because your distribution costs dropped to near zero.
Your competitors will figure this out eventually. The question is whether you move first.
Frequently Asked Questions
Does Meta’s digital service tax apply to all advertisers?
The DST surcharge applies based on where your ad account is billed, not where your ads run. If your billing address is in a country where Meta passes through a DST — currently 11+ countries including France (5%), UK (2%), Turkey (7.5%), and India (2%) — you’ll see the surcharge on your invoice (Meta Business Help Center, 2026). Moving your billing entity to a non-DST country is one mitigation strategy, but it carries its own legal and tax complexity.
Can PWA distribution offset the cost of Meta’s DST surcharges?
In most cases, yes — and significantly. A 3-5% DST surcharge on a $50,000/month ad budget costs $1,500-$2,500/month. Switching from Google Play’s 30% commission to PWA’s 3% web processing on $100,000/month revenue saves $27,000/month. The distribution savings outweigh the DST cost by roughly 10:1. You can’t eliminate the tax, but you can make it irrelevant to your bottom line.
How long does a PWA migration take with ROiBest?
Typical timeline is 5-10 business days from kickoff to live deployment. That includes PWA packaging, push notification configuration, and install page setup. Most teams run PWA as a parallel channel alongside their existing store listing first, then shift primary distribution after validating conversion metrics. There’s no need to shut down your Google Play listing while you test.
Will Meta add more countries to the DST surcharge list?
Almost certainly. The OECD’s Pillar One framework — which was supposed to replace unilateral DSTs with a coordinated global approach — has repeatedly missed deadlines, with the latest target pushed to late 2026 at earliest (OECD, 2025). In the absence of a global deal, more countries are implementing their own DSTs. Canada, Malaysia, and several Latin American countries have DST proposals in progress. The trend points toward more countries and higher rates.
Does DST apply to PWA distribution or web payment processing?
No. Digital service taxes target the revenue of large digital platforms — advertising networks, online marketplaces, and social media companies above specific revenue thresholds (typically EUR 750 million global and EUR 50 million domestic). A publisher collecting payments through their own website via Stripe or similar processors is not subject to DST. The tax structure specifically targets intermediary platform revenue, not direct publisher transactions.
Skip the app store. Go live instantly, keep 100% of your revenue.
ROiBest helps Android app teams launch PWAs — no review process, no 30% Google Play cut, and push notifications that work even after uninstall. Teams see up to 1.2x higher install conversion rates vs native app downloads.
 WebApp中文站
留下评论